
Rates Outlook – The year of bonds redux
- 30 November 2023 (7 min read)
Key points
- While monetary policy is quite restrictive, there are reasonable doubts about overall economic stance
- Demand and supply conditions need careful monitoring
- 2023 has been the year of money markets and credit, not necessarily the year of all fixed income
- Investors might increasingly focus on carry as a driver of returns in 2024, potentially compensating them for still uncertain policy paths
Are interest rates restrictive enough?
The Federal Reserve has hiked by 525bps over just 17 months, lifting the Fed Funds Rate to 5.50%. And yet, the US economy is likely to grow by 2.3% in 2023, up from 1.9% in 2022. The days when a recession was priced in with nearly 100% probability – not too long ago – are now gone, and the Bloomberg consensus has revised its expectations for US GDP growth month after month, starting from a rather modest 0.3% in early January.
Central bankers on both sides of the pond are convinced about their restrictive monetary stance and we might agree on that, but the real question is about the overall economic policy stance. There are no doubts that fiscal policy is going the other way and is actually adding stimulus to the economy, both in the US and the Eurozone, and therefore somewhat diluting monetary policy’s restrictive efforts. Former ECB board member Fabio Panetta has addressed this issue in the not-too-distant past by highlighting the asymmetric orientation of monetary and fiscal policy. Of course, we’re all reminiscent of the high degree of uncertainty and market volatility created by former UK Prime Minister Liz Truss and her expansionary budget.
Furthermore, the ultimate effect of higher policy rates must be assessed in the context of inverted yield curves and slower pass-through to interest expenditures. It should be no mystery that both corporate and public sector treasurers have lengthened debt duration during the zero-interest rate period. Similarly, the effective mortgage rate might be much lower than indicated by markets, as households have fixed their debt over a long period of time at very low rates. Perhaps the economy is less sensitive to interest rates than in the past?
Real rates in the driving seat
Real rates started to edge higher in March 2022, after nominal rates had already drifted 180bp higher compared to pandemic-era lows. The reflation trade has been characterised by two distinct legs – inflation expectations moving from 1% to 3%, and real rates moving from -1% to +2.4% (Exhibit 1).
Exhibit 1: Higher real rates in 2022 and 2023
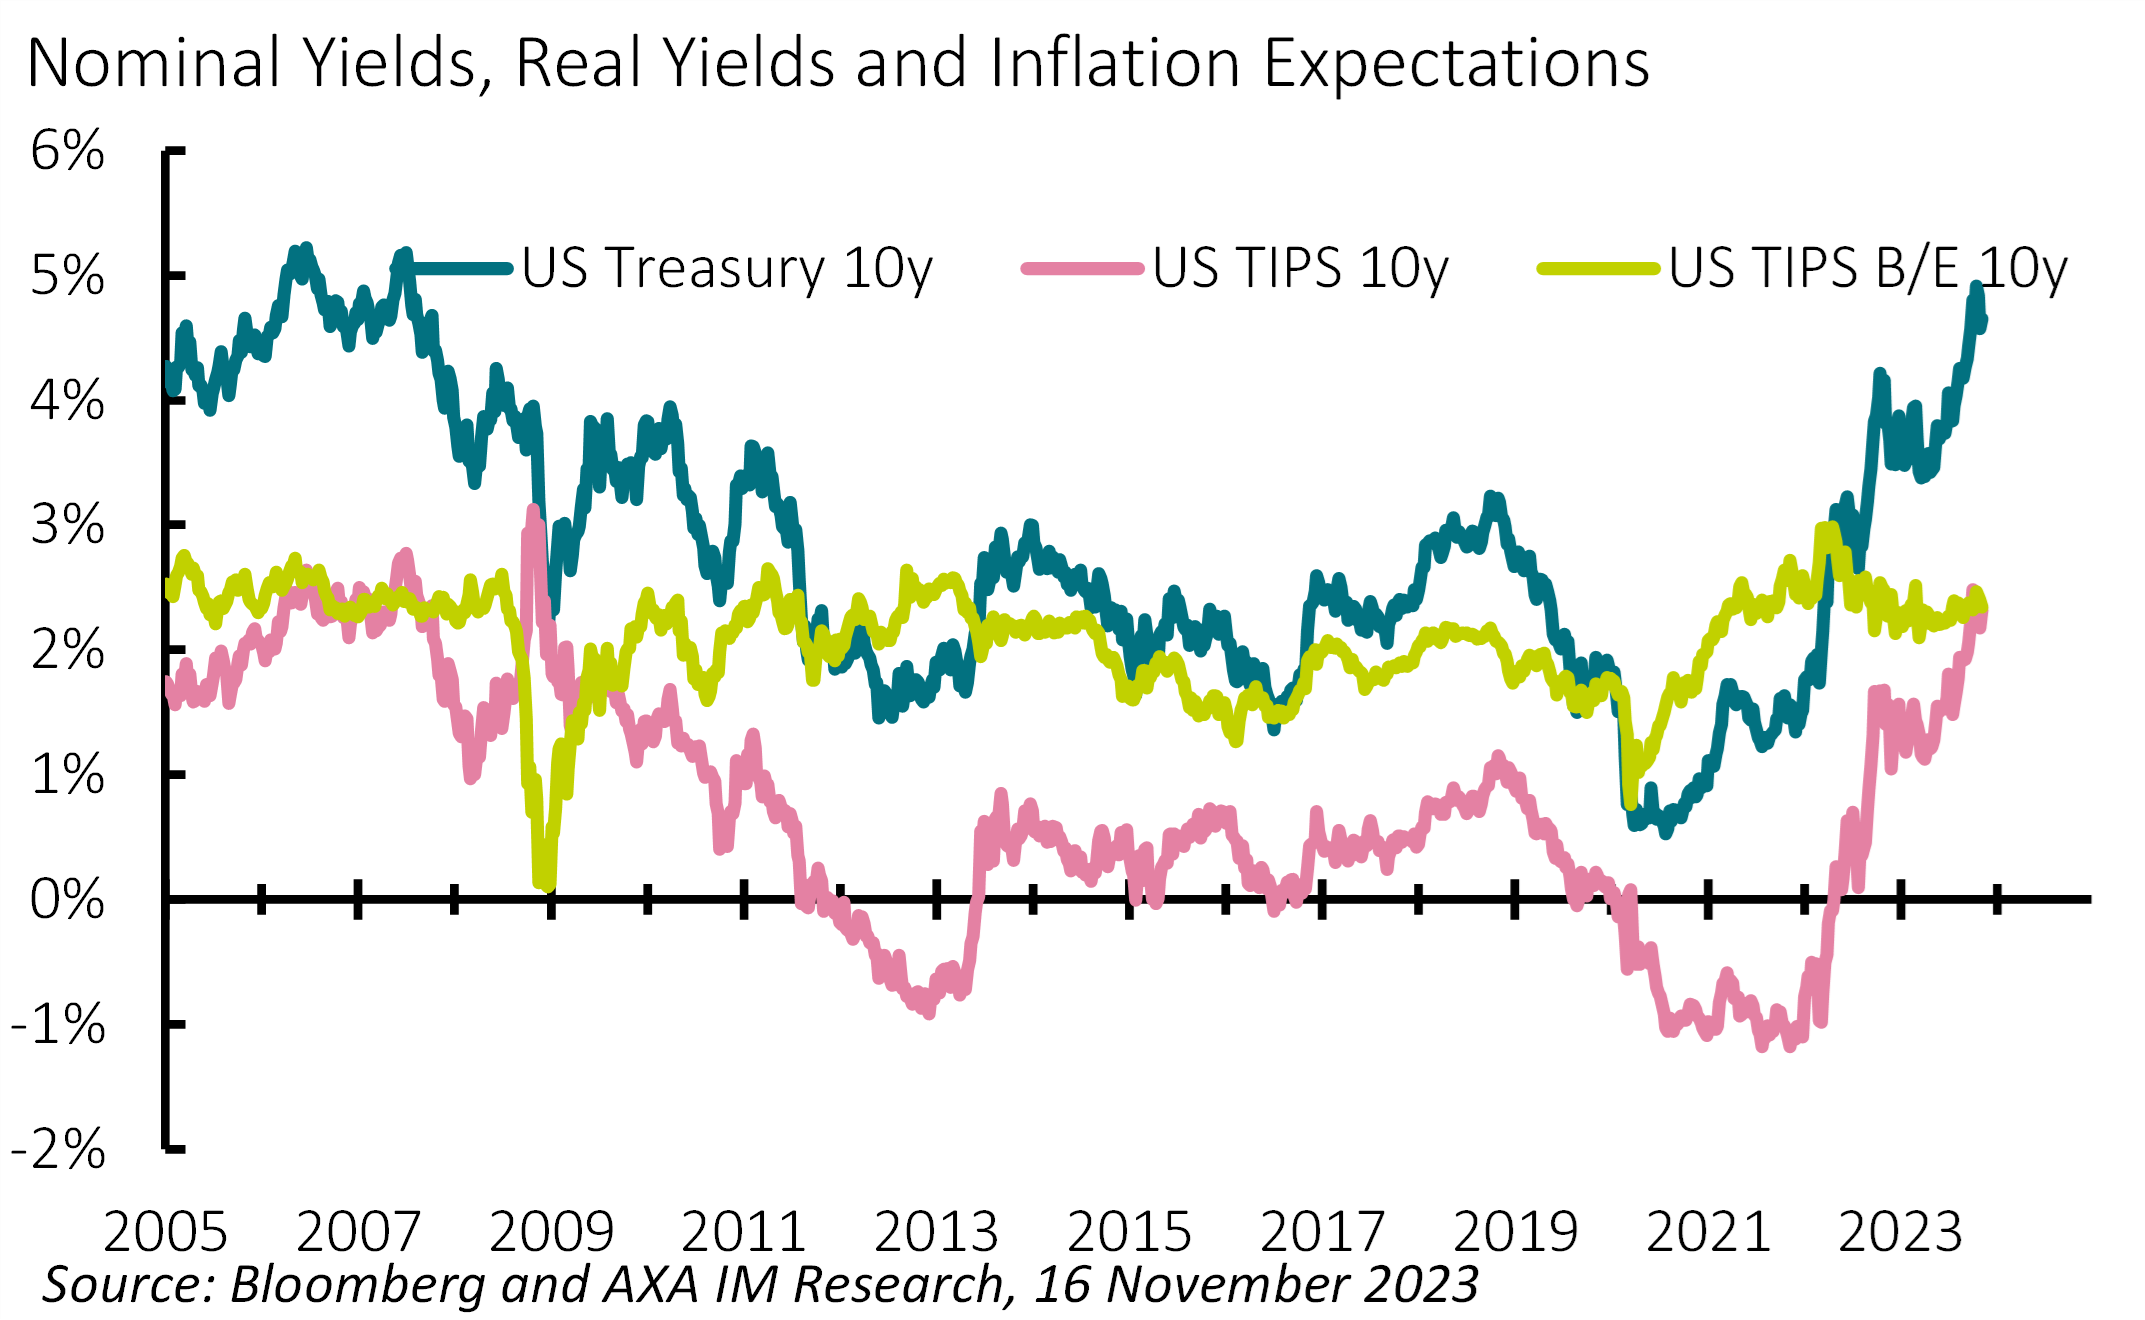
Leaving inflation expectations aside – and assuming convergence to 2% objectives will take a few more years (as projected by central banks) – we might want to ask ourselves the question about the drivers of real rates. In fact, a higher level of real rates should be consistent with an economy growing at a higher potential rate. A deep dive into models of economic growth is outside our scope, but we should not dismiss the idea that the US economy might have experienced a technology shock – via machine learning and artificial intelligence – which ultimately makes it more productive and lifts the long-term potential GDP.
In practical terms, this argument opens the door to yet another source of so-called policy dilution and stimulates the well-known discussion around the Fed’s neutral rate. Of course, we will only know in the future how high the Fed Funds Rate is relative to a non-observable neutral rate, but at the same time policy makers should learn from errors in the late 1960s and early 1970s, when US monetary policy was believed to be sufficiently restrictive – it turned out to be not the case when it was already too late.
Duration: Yes or no?
Central bankers can take three actions regarding their policy rate: cut, hike or leave it unchanged. Currently, markets are discounting the ECB’s and Fed’s initial rate cut to occur by June 2024, an expectation that has accompanied investors ever since mid-2022 (Exhibit 2). However, market-based expectations have been wrong by a substantial margin so far.
Exhibit 2: Pricing in rate cuts since July 2022
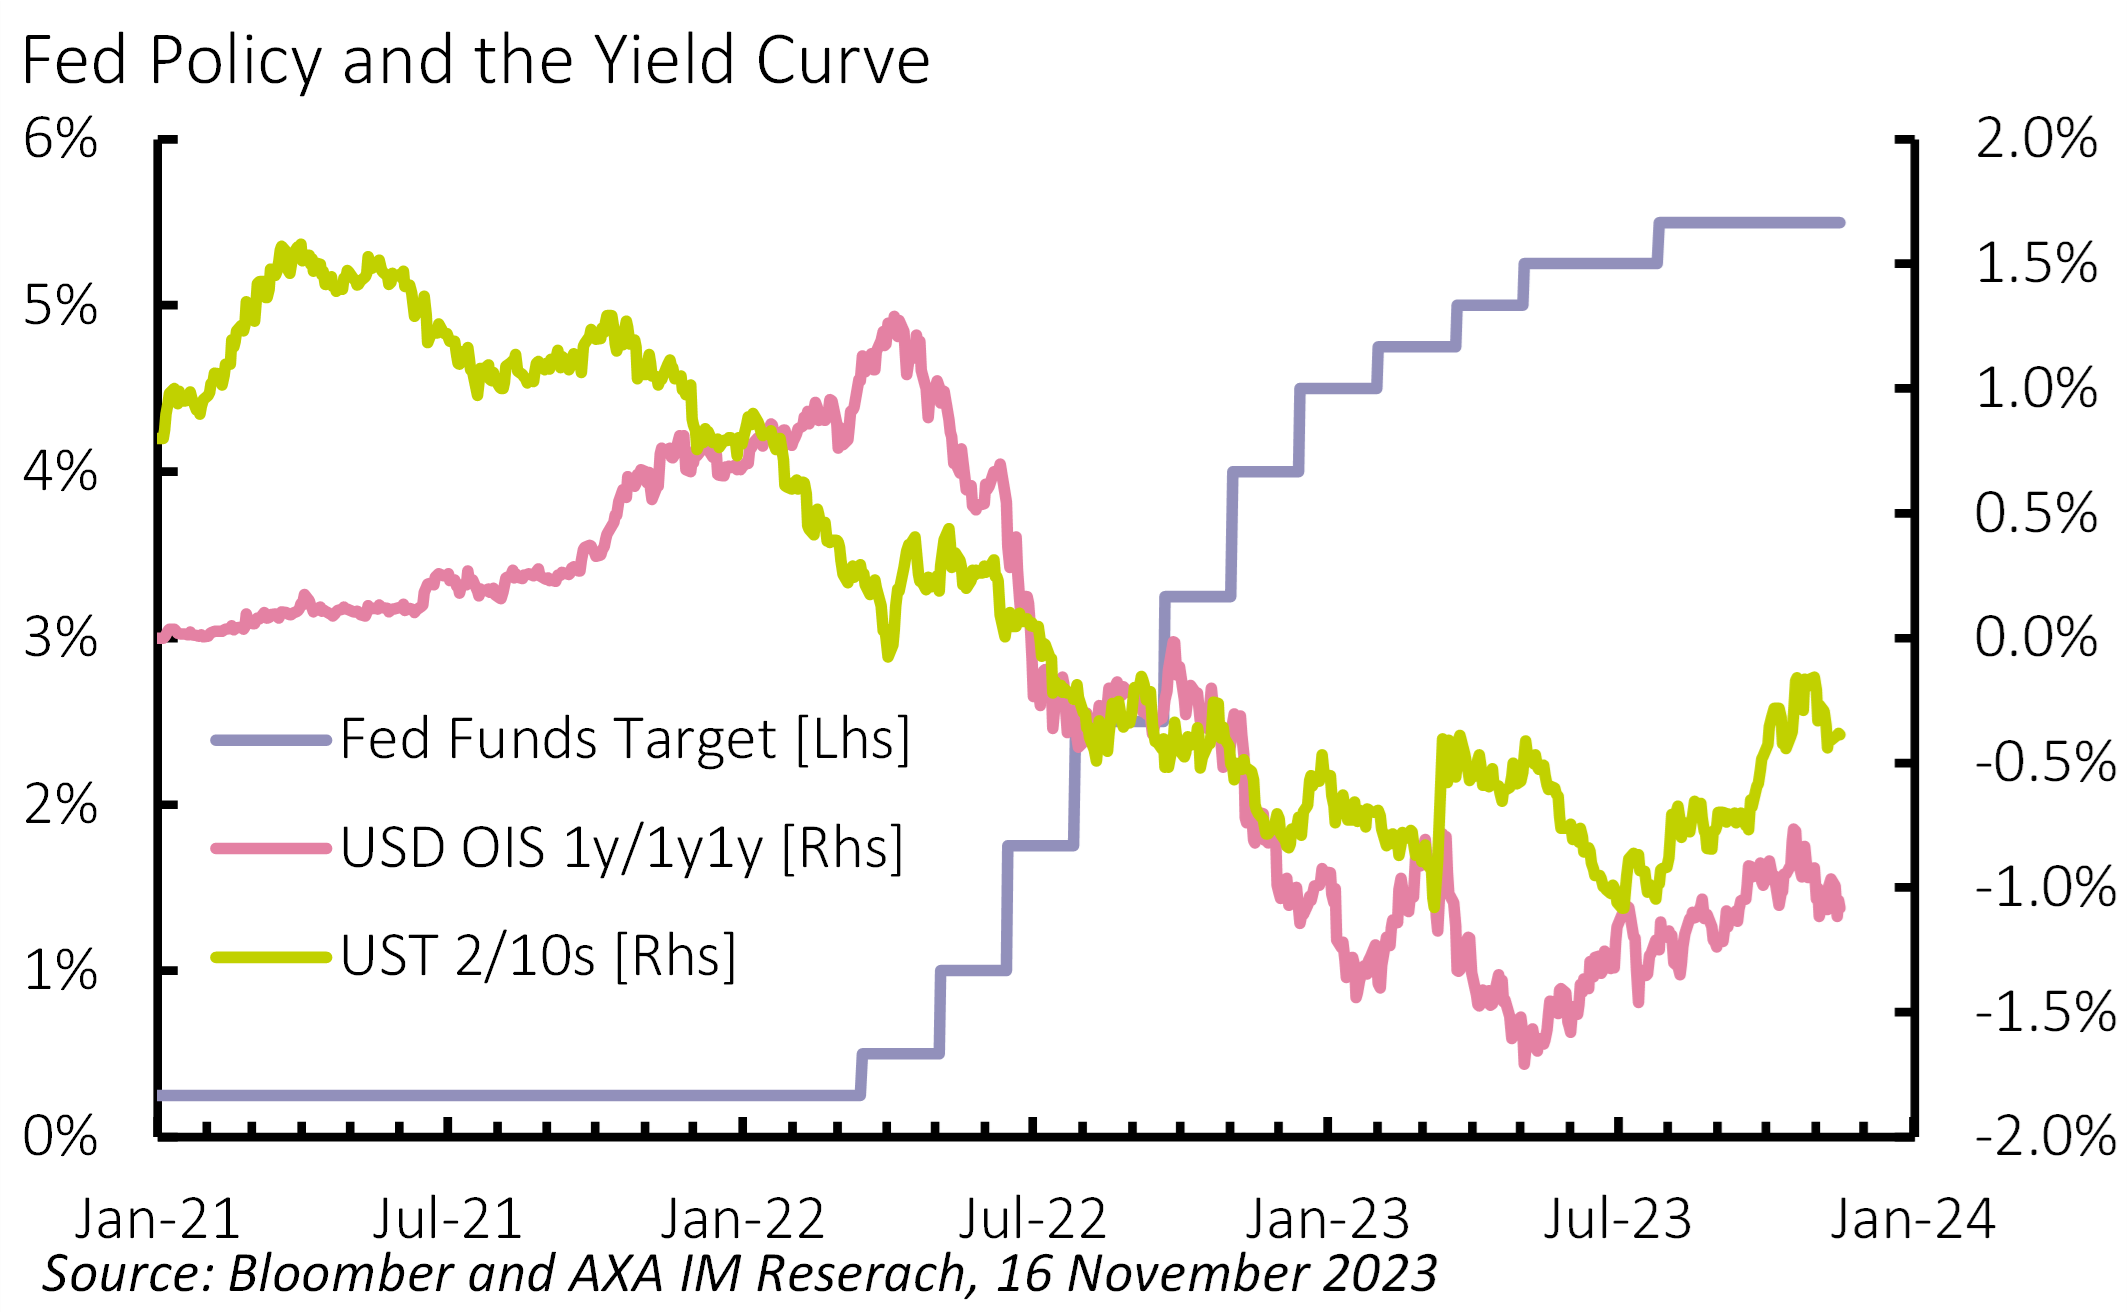
A higher duration exposure might be a profitable choice in two out of three scenarios, in particular (and obviously) in a rate cut situation. The unchanged rates scenario merits a few more observations, though. Central banks might want to keep rates at current levels for a longer-than-anticipated period to play the long and variable lags implied by their models. The time horizon is variable as well and really depends on the economy’s reaction to their policy tightening. The longer they stay put, however, the higher the odds that their policy decision will be felt also at longer maturities.
The yield curve’s response to a “higher-for-longer” scenario is all that matters for fixed income investors’ duration choice. The main risk here is a yield curve normalisation – from an inverted to a flat or slightly steep curve – that might be fast enough to negate the relatively large coupon income. This normalisation is worth approximately 2.5%-3% negative price return, probably not enough to generate a negative total return over the year, but definitely large enough to test investors’ patience again.
Credit risk has paid well in 2023
Credit and high yield particularly are areas of fixed income where “the year of bonds” is actually a fairly accurate description. By mid-November, Bloomberg’s Global High Yield universe has gained over 7% year-to-date in US dollar terms. This result has been achieved not only thanks to a rather contained duration profile but also to a benign spread environment. A much better than originally anticipated macroeconomic environment has prevented spreads from lifting off despite higher rates and the accumulation of geo-political risks.
By contrast, duration exposure has not been rewarding at all and delivered a negative year-to-date performance by mid-November: The Bloomberg Global Aggregate 10+ year index is down 3.5% in US dollar terms versus a +1.1% performance for the same index’s one-to-three-year duration bucket.
Unfortunately, fixed income is often confused with duration. Every cash flow has a duration, but we should treat this variable actively, i.e. as a risk variable, rather than as a random by-product of our bond portfolio allocation. Duration is essentially a commodity in fixed income space and as such might add to or subtract from total return.
2024: The year of bonds redux?
Expect investors to focus on carry in 2024 (i.e., borrow and pay interest to purchase another asset with a higher interest rate), even more than they might have done – albeit with mixed results – this year. Carry has the beneficial property of reducing the cost of being on the wrong side of a trade, thus increasing investors’ confidence in entering and holding to a position. Risks will mainly result from the macro side and the associated monetary policy paths. In this respect, the Bank of Japan and Japanese government bonds might be the proverbial elephants in the room.
Exhibit 3: Who Will Buy Bonds?
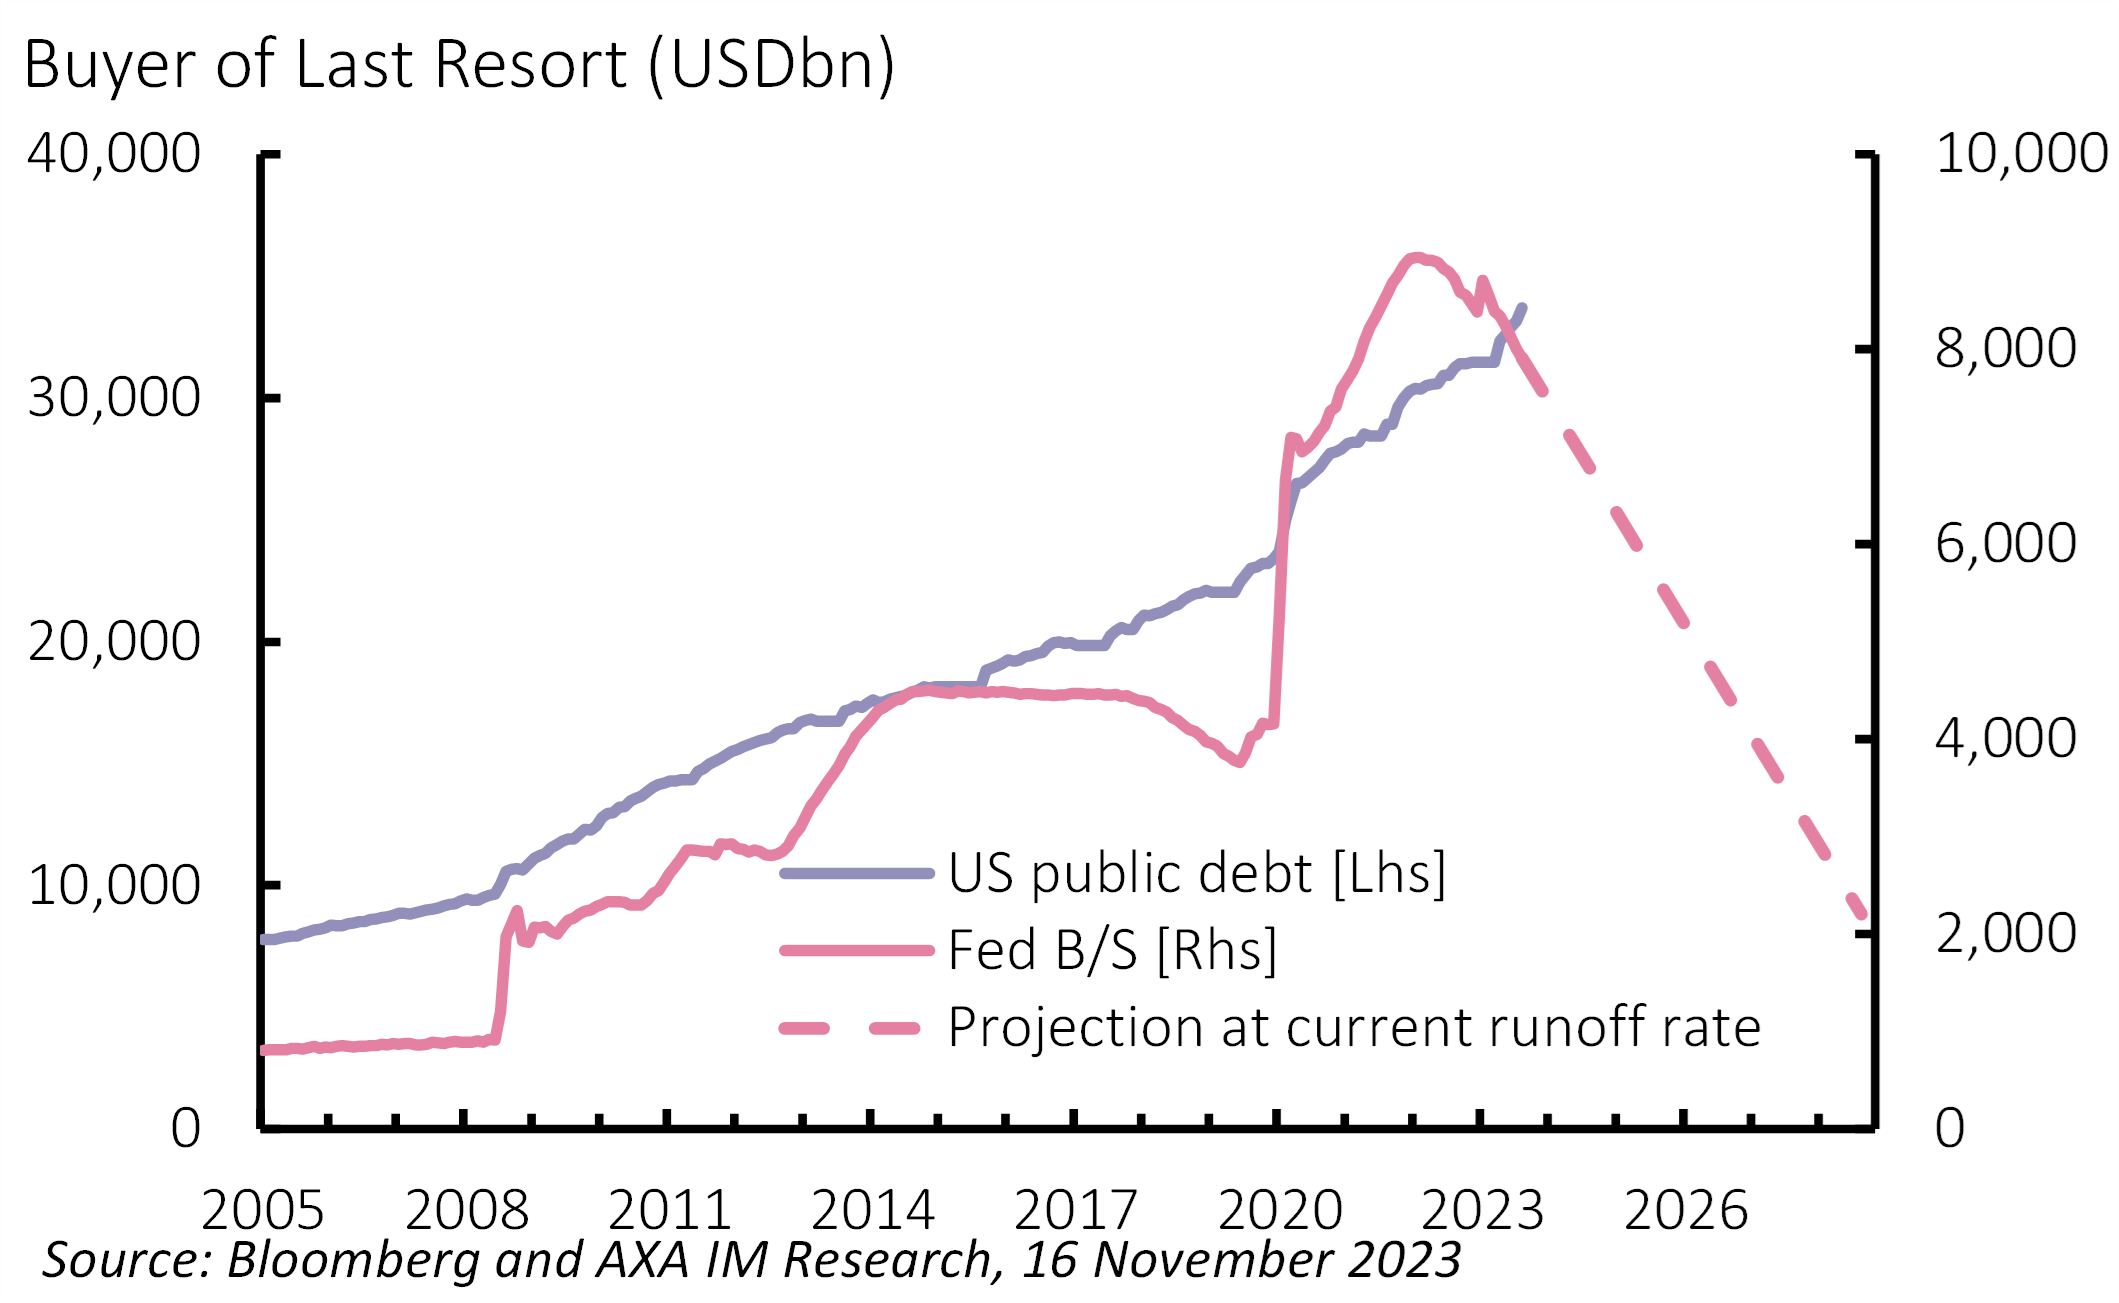
Furthermore, every market price is the result of demand and supply variables. Demand conditions need to be monitored carefully in an environment where major central banks reduce their large economic footprint (Exhibit 3) and governments keep running public deficits on a path that has recently drawn criticism from the International Monetary Fund. The situation is particularly pressing for those countries starting from substantial debt-to-GDP levels and/or modest potential growth, which is so often the result of mediocre political choice leading to an inferior allocation of resources and ultimately to structural and demographic impoverishment.
Our views for 2024
View all articles

Beware the merchants of doom
- by Nigel Topping
- 06 December 2023 (5 min read)


Disclaimer
This document is for informational purposes only and does not constitute investment research or financial analysis relating to transactions in financial instruments as per MIF Directive (2014/65/EU), nor does it constitute on the part of AXA Investment Managers or its affiliated companies an offer to buy or sell any investments, products or services, and should not be considered as solicitation or investment, legal or tax advice, a recommendation for an investment strategy or a personalized recommendation to buy or sell securities.
It has been established on the basis of data, projections, forecasts, anticipations and hypothesis which are subjective. Its analysis and conclusions are the expression of an opinion, based on available data at a specific date.
All information in this document is established on data made public by official providers of economic and market statistics. AXA Investment Managers disclaims any and all liability relating to a decision based on or for reliance on this document. All exhibits included in this document, unless stated otherwise, are as of the publication date of this document.
Furthermore, due to the subjective nature of these opinions and analysis, these data, projections, forecasts, anticipations, hypothesis, etc. are not necessary used or followed by AXA IM’s portfolio management teams or its affiliates, who may act based on their own opinions. Any reproduction of this information, in whole or in part is, unless otherwise authorised by AXA IM, prohibited.
Neither MSCI nor any other party involved in or related to compiling, computing or creating the MSCI data makes any express or implied warranties or representations with respect to such data (or the results to be obtained by the use thereof), and all such parties hereby expressly disclaim all warranties of originality, accuracy, completeness, merchantability or fitness for a particular purpose with respect to any of such data. Without limiting any of the foregoing, in no event shall MSCI, any of its affiliates or any third party involved in or related to compiling, computing or creating the data have any liability for any direct, indirect, special, punitive, consequential or any other damages (including lost profits) even if notified of the possibility of such damages. No further distribution or dissemination of the MSCI data is permitted without MSCI’s express written consent.