
Equity Outlook – Thriving in the mist
Key points
- 2023 was an unusual period for equity markets, which made gains despite sharp interest rates rises. However, only a handful of stocks drove these gains
- As we expect rates to remain high, we believe quality should be considered over the duration of securities
- The question of ‘who’s right’ between GDP and earnings consensus has to be solved, and one of these two projections is likely to be wrong
There is no doubt that 2023 was a year for the textbooks. Low economic growth, high inflation and hawkish central banks were not enough to moderate overall equity market gains. Instead, this trio’s momentum supported the asset class.
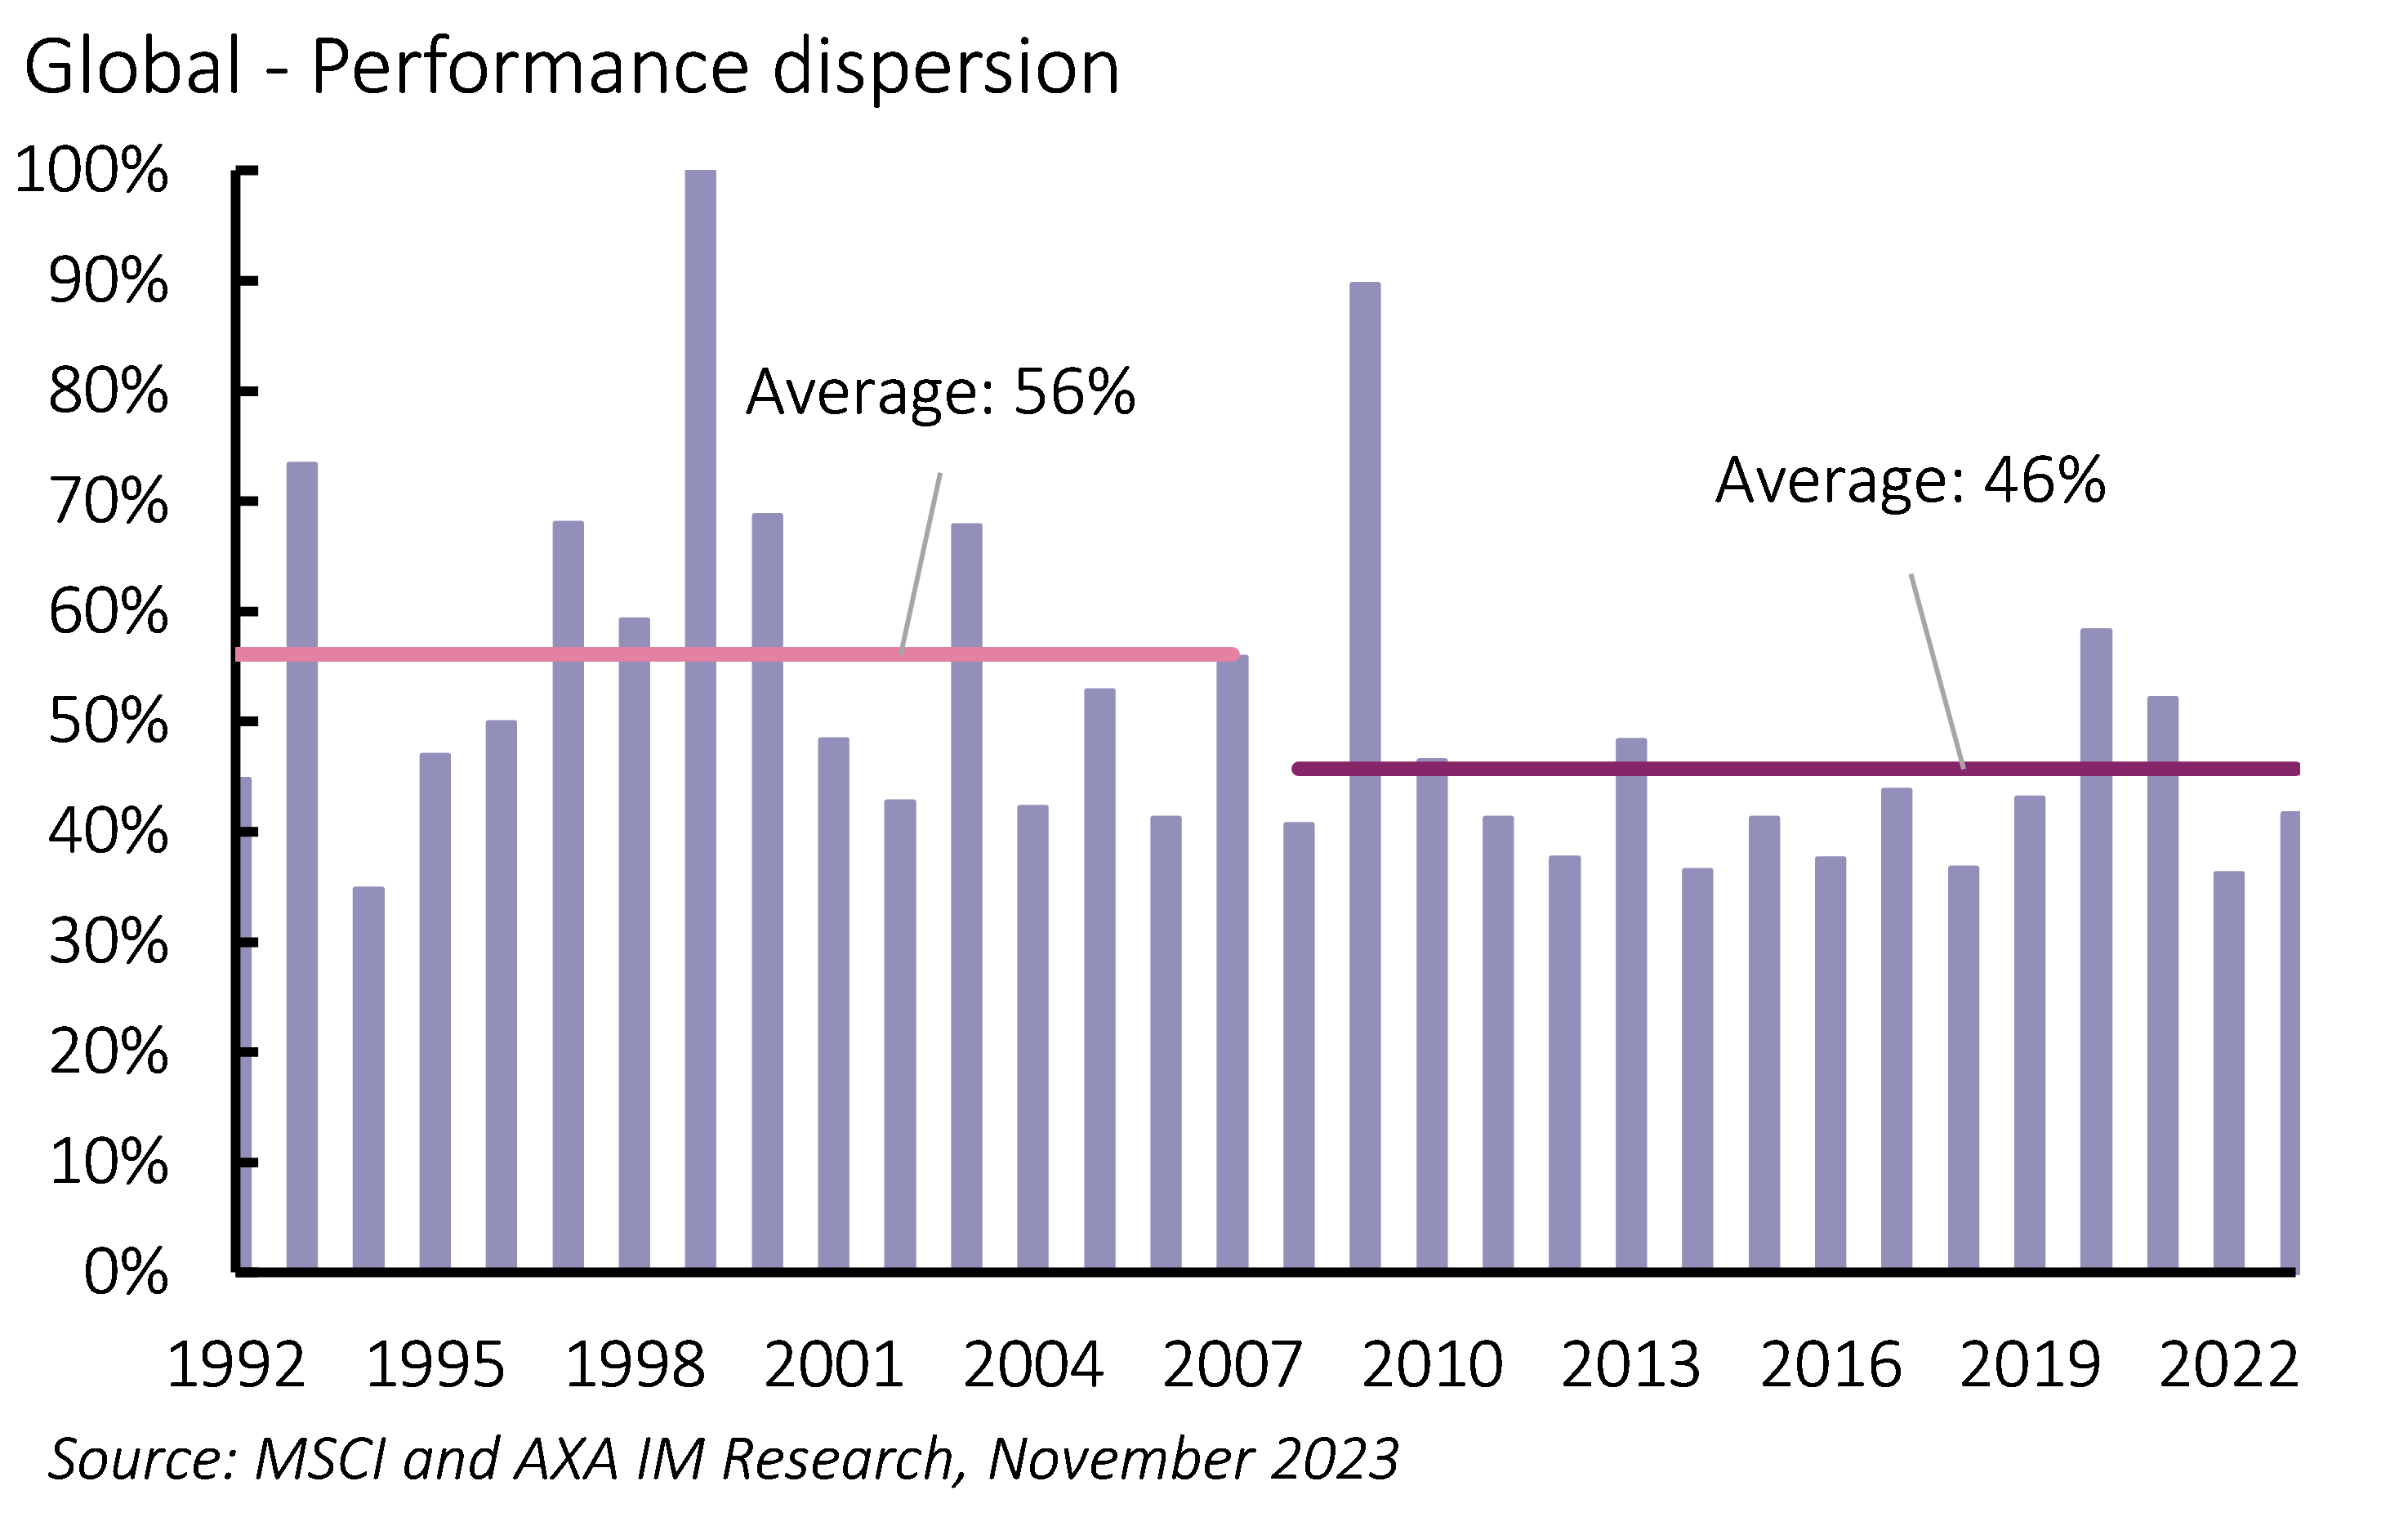
But 2023’s performance should be taken with a pinch of salt, as it was largely attributable to a few large-cap stocks. The top 10% of companies ranked by market capitalisation gained 17%, compared with just 3% for the rest. But this divergence in returns between the component stocks of the global index is not abnormal, as evidenced by the below-average level of dispersion (Exhibit 1).
In the future, dispersion could settle higher in the context of higher interest rates. In such a scenario, the equity risk premium would be lower, creating a higher hurdle rate for companies, so active management should overtake passive.
Exhibit 1: Super dispersion
Throughout the course of the year, real global GDP growth expectations have steadily been revised higher, offering support to upward earnings revisions. Although global profits have declined, companies surprised on the upside thanks to the resilience of profit margins.
Interest rate volatility was clearly one of the determining factors of equity market performance. As inflation fell, however, central banks began to halt their tightening cycles. This has been reflected in a performance driven by the multiple expansions in global equity markets, which is at odds with the rise in interest rates.
In our central scenario where growth remains sluggish but a recession is avoided, inflation heads back towards its target and central banks broadly start to reverse course in the second half of the year. We believe that global equities should generate a positive return with some volatility likely reflecting the precise timing of when central banks reverse course.
High for longer
Uncertainties over the short and long ends of US interest rate curves were one of the highlights of the year. These uncertainties were explained for the short end by the constant revision of the expected peak rate until mid-year and then the scale of cuts thereafter, while apparent reassessment of the 'neutral rate' mainly occurring in the second half of the year helped explain higher term rates.
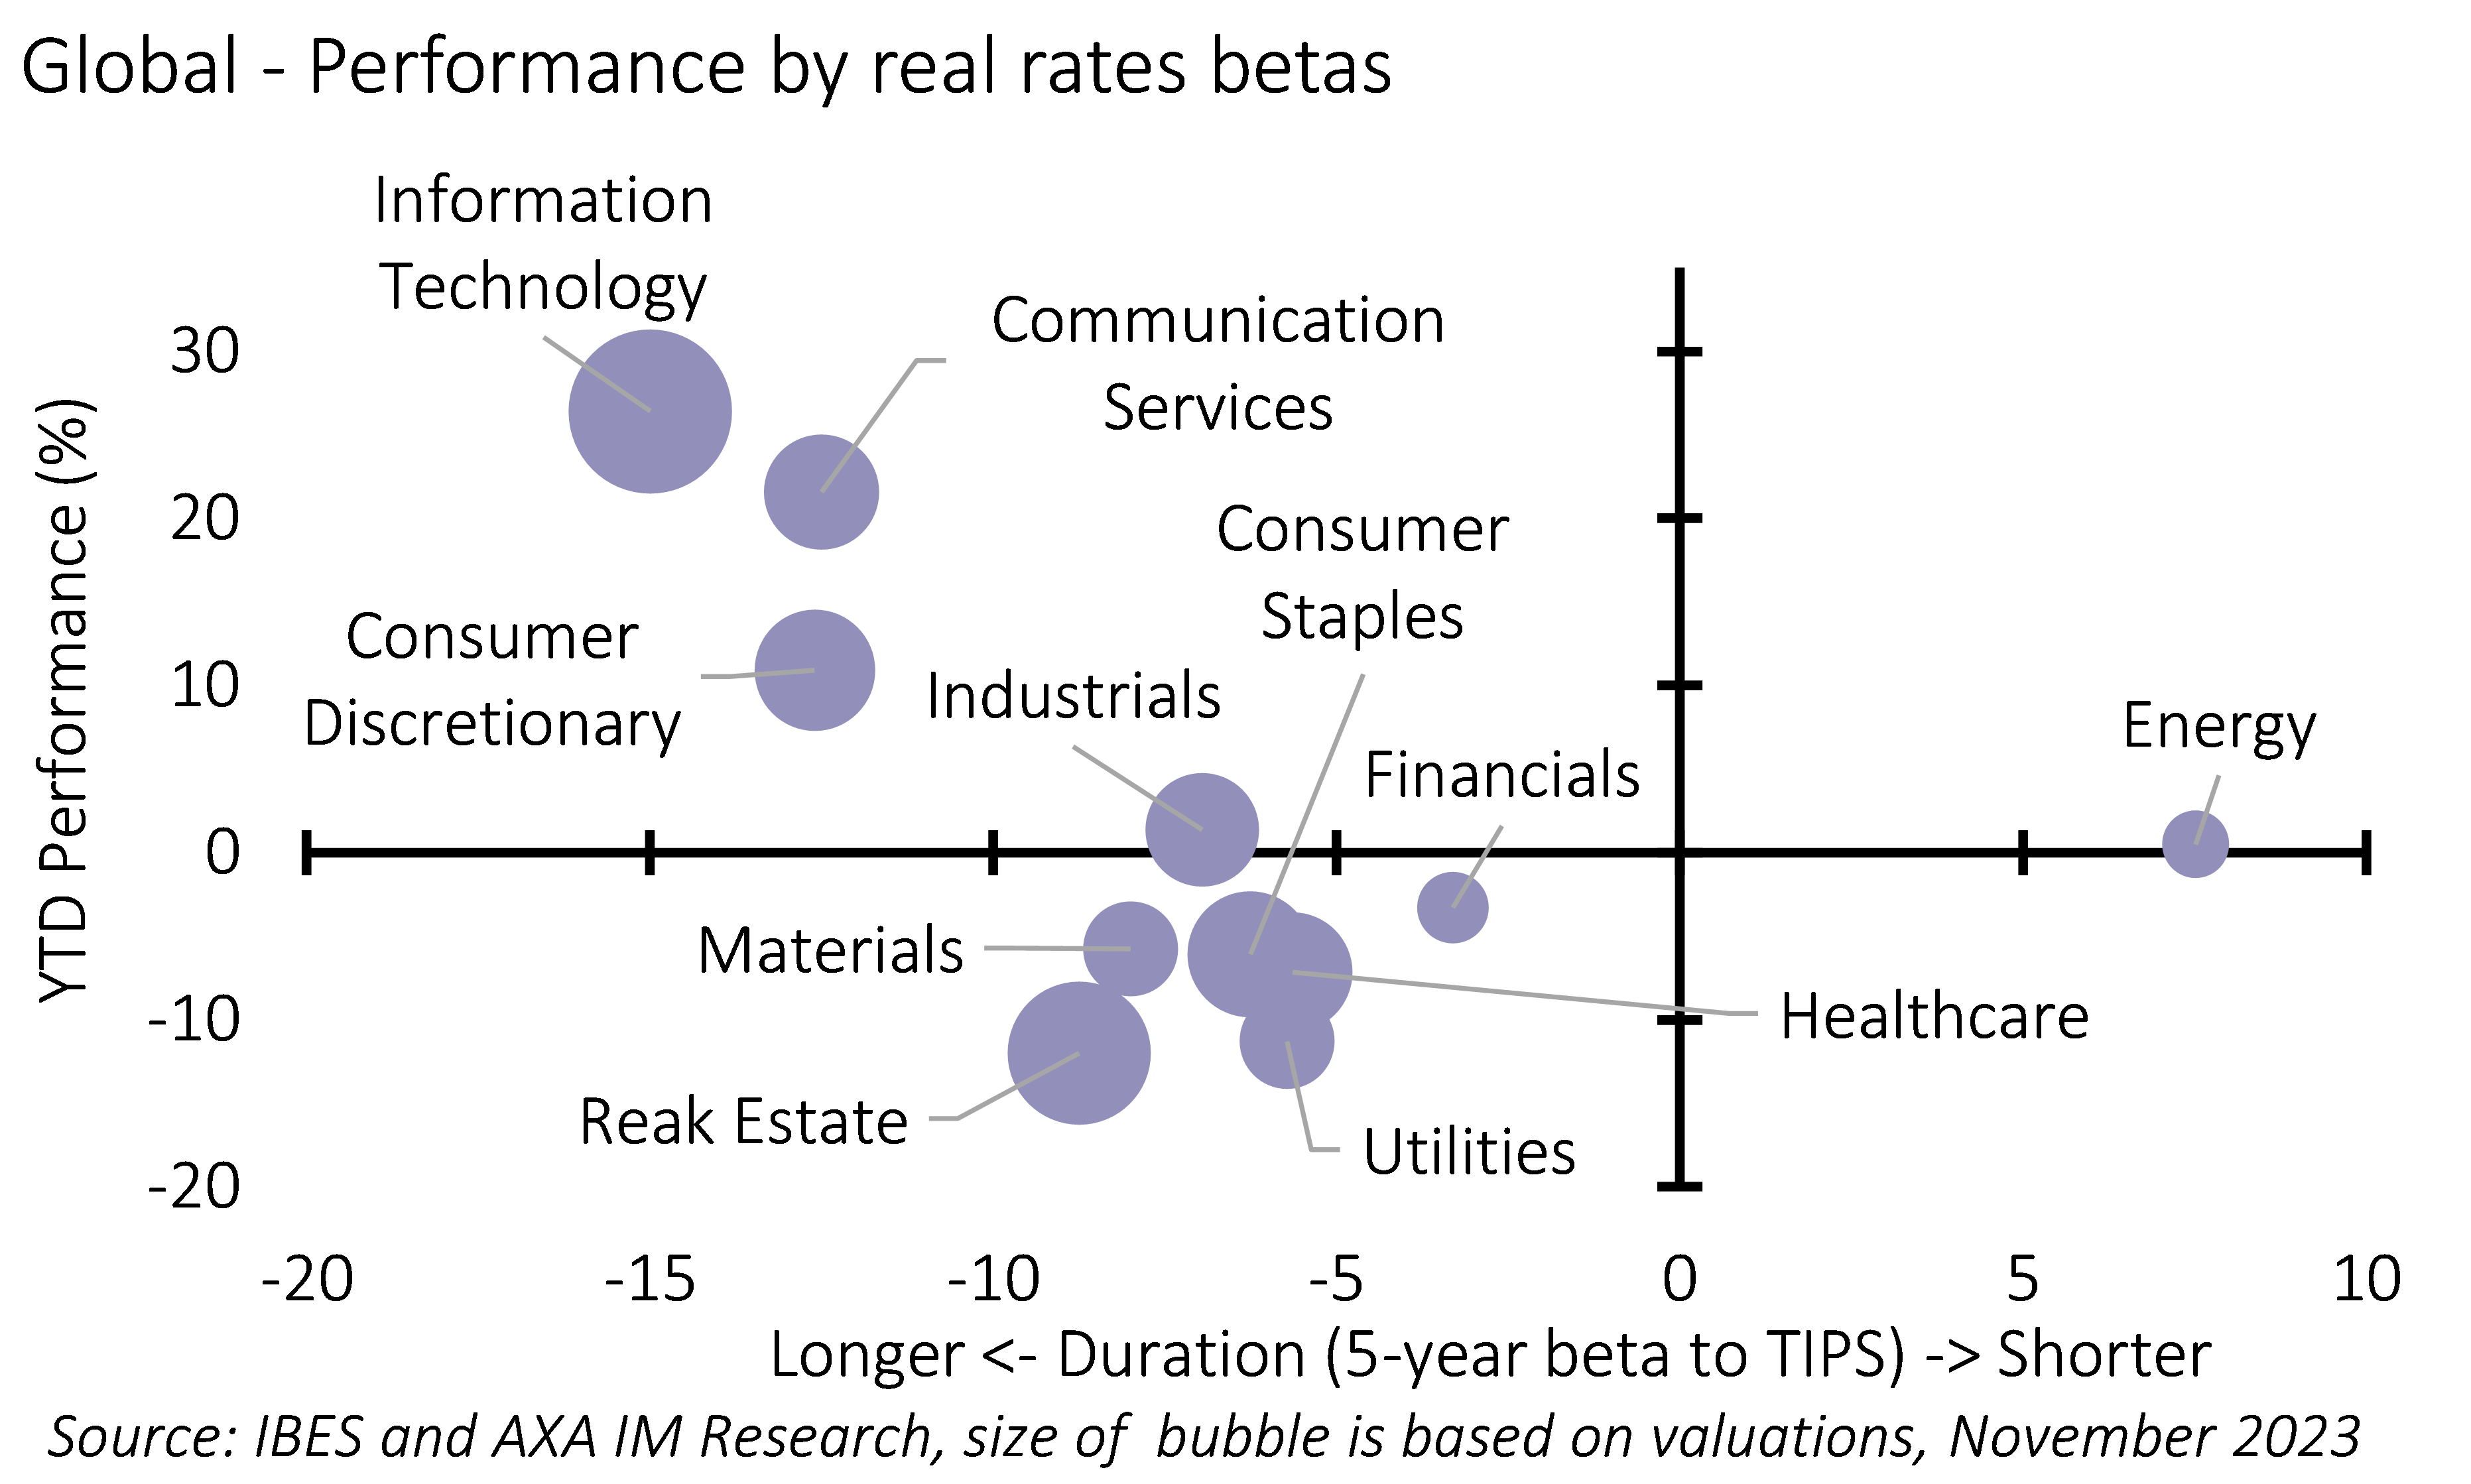
Exhibit 2: Long duration did well despite higher interest rates
There is still uncertainty about the exact timing of the rate cut, but markets are counting on a change towards the end of the first half of 2024 – our own view is for the first cut to be delivered in June 2024. But investors are more convinced rates will stabilise at higher levels for longer, and this convergence of views should mitigate long-term interest rate risks for equities.
Yet the impact of rising interest rates on equities has not been observed in the usual way. Long duration stocks did not fall significantly (Exhibit 2). Instead, those names outperformed the rest of the market and, for instance, value (+2.5%) has underperformed growth (+25.6%).
How do we explain this? The rise in real rates has been uneven – the first half of the year saw real rates remain fairly stable; they then rose by around 80 basis points (bp) from late June. This has been a determining factor in the relative performance of growth versus value (first half: +20.5%, second: +1.8%).
Additionally, it is important to note that, at present, long-duration companies generally have relatively sound balance sheets. Currently, the information technology (IT) sector is the least leveraged, unlike in the past. As a result, equity investors have rewarded these quality stocks regardless of their valuation.
For 2024, we believe the market will continue to favour low-leverage stocks. Also, reaching a new range in long-term rates would suggest less volatility in interest rates, which would improve growth stocks’ forward earnings visibility. This is why a barbell allocation to IT (benefiting from lower rate volatility) and financials (benefiting from structurally higher rates) looks reasonable.
Sluggish growth outlook
At the global level, analysts have consistently and significantly upgraded their 2024 forecasts for earnings growth expecting +11% while consensus GDP forecasts have declined to +2.6% from +3.1% (Exhibit 3). This discrepancy has resulted in an inconsistent relationship between earnings and GDP.
Exhibit 3: The market and macro at odds
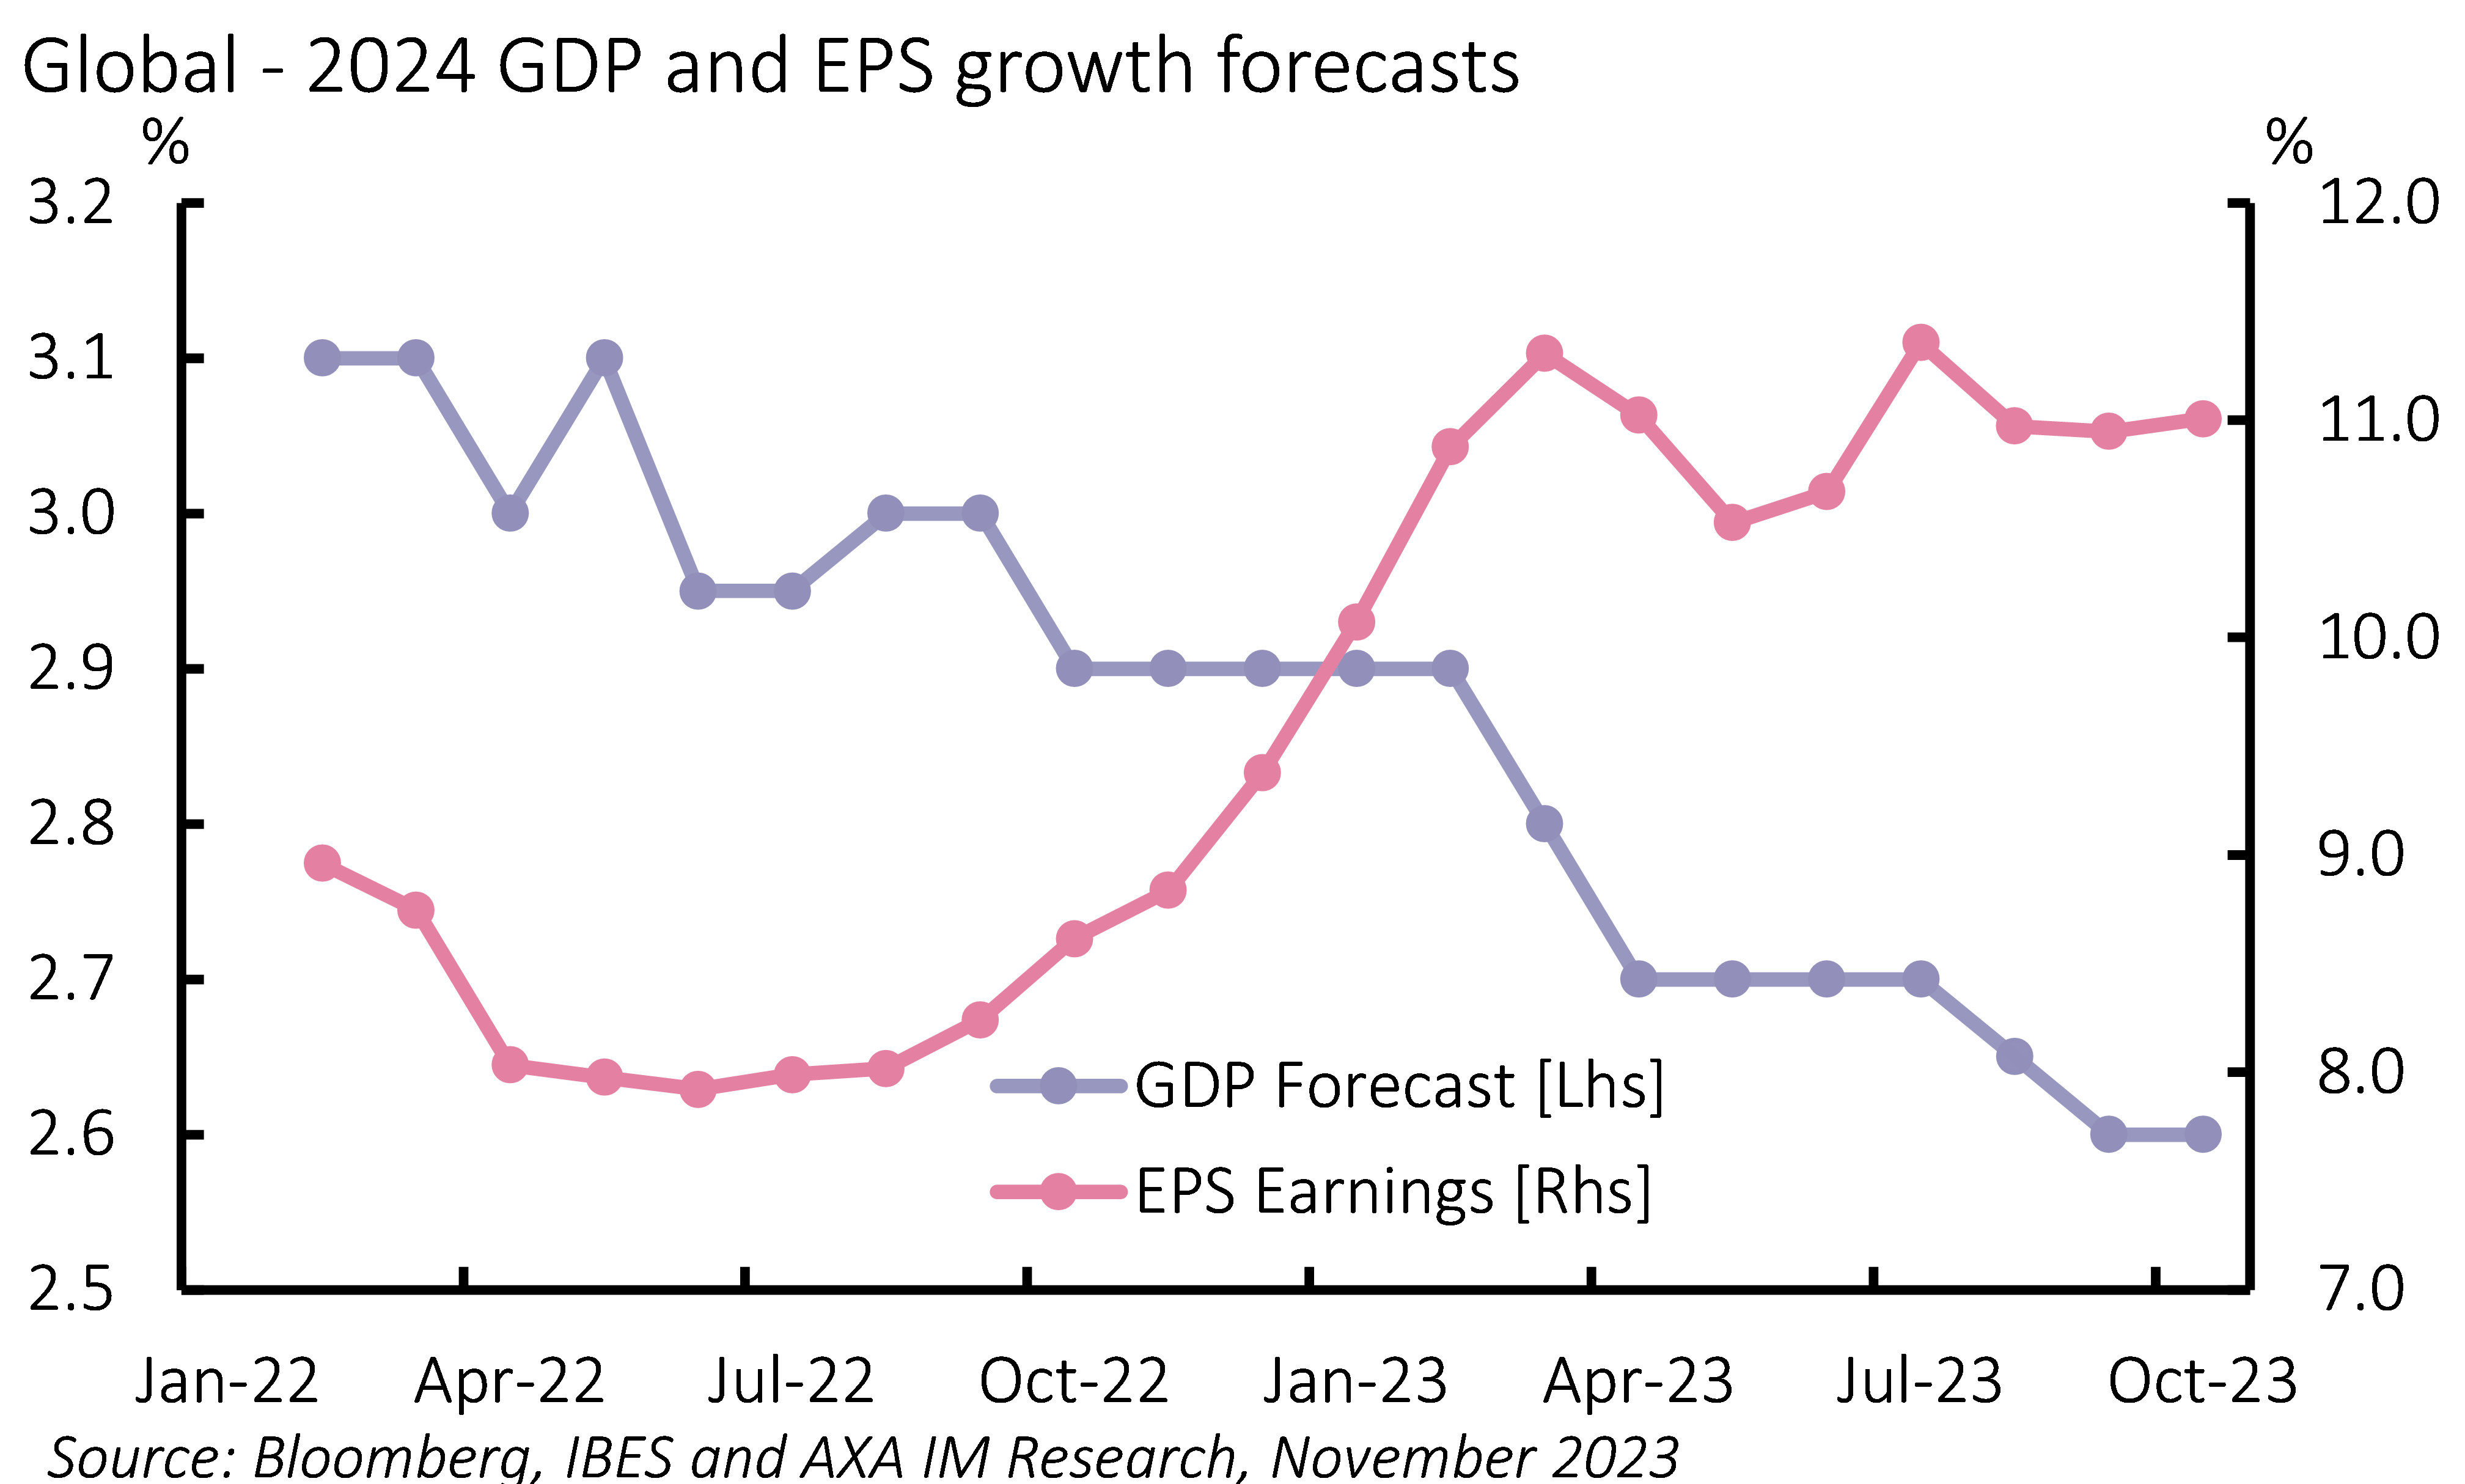
The resilience in earnings-per-share has been largely attributed to resilient margins. However, we expect this resilience to fade in 2024, after positive surprises of the results published by companies this year. With pressure from slowing inflation (lower pricing), tight financial conditions and still increasing wage growth, the profit margin could evolve at a below trend pace next year. This suggests a fall in consensus margin expectations of the order of at least 150/300 percentage points for Europe and US market constituents respectively.
Yet this margin contraction alone would not be sufficient to bring earnings growth in line with our 2024 GDP growth forecasts. To achieve this, sales would also require a sizeable downward revision, as the consensus is for +5% in the US and +2.6% in Europe. Such a scenario would push multiples even higher, prompting a greater potential of correction in share prices, although we should not ignore the chance of an upward adjustment in economic growth, as we have seen this year.
If economic growth was to be revised up in 2024, we would prefer exposure to the US than to the rest of the world as historically, upward revisions of US GDP forecasts have been a catalyst for forward US outperformance versus global equities.
To get in on this theme, we think that a long position on US cyclicals, which are currently cheap, would be a judicious move. On a relative basis, we are cautious on emerging markets cyclicals given the uncertainty surrounding the Chinese economic situation.
Exhibit 4: Japan is at the right spot
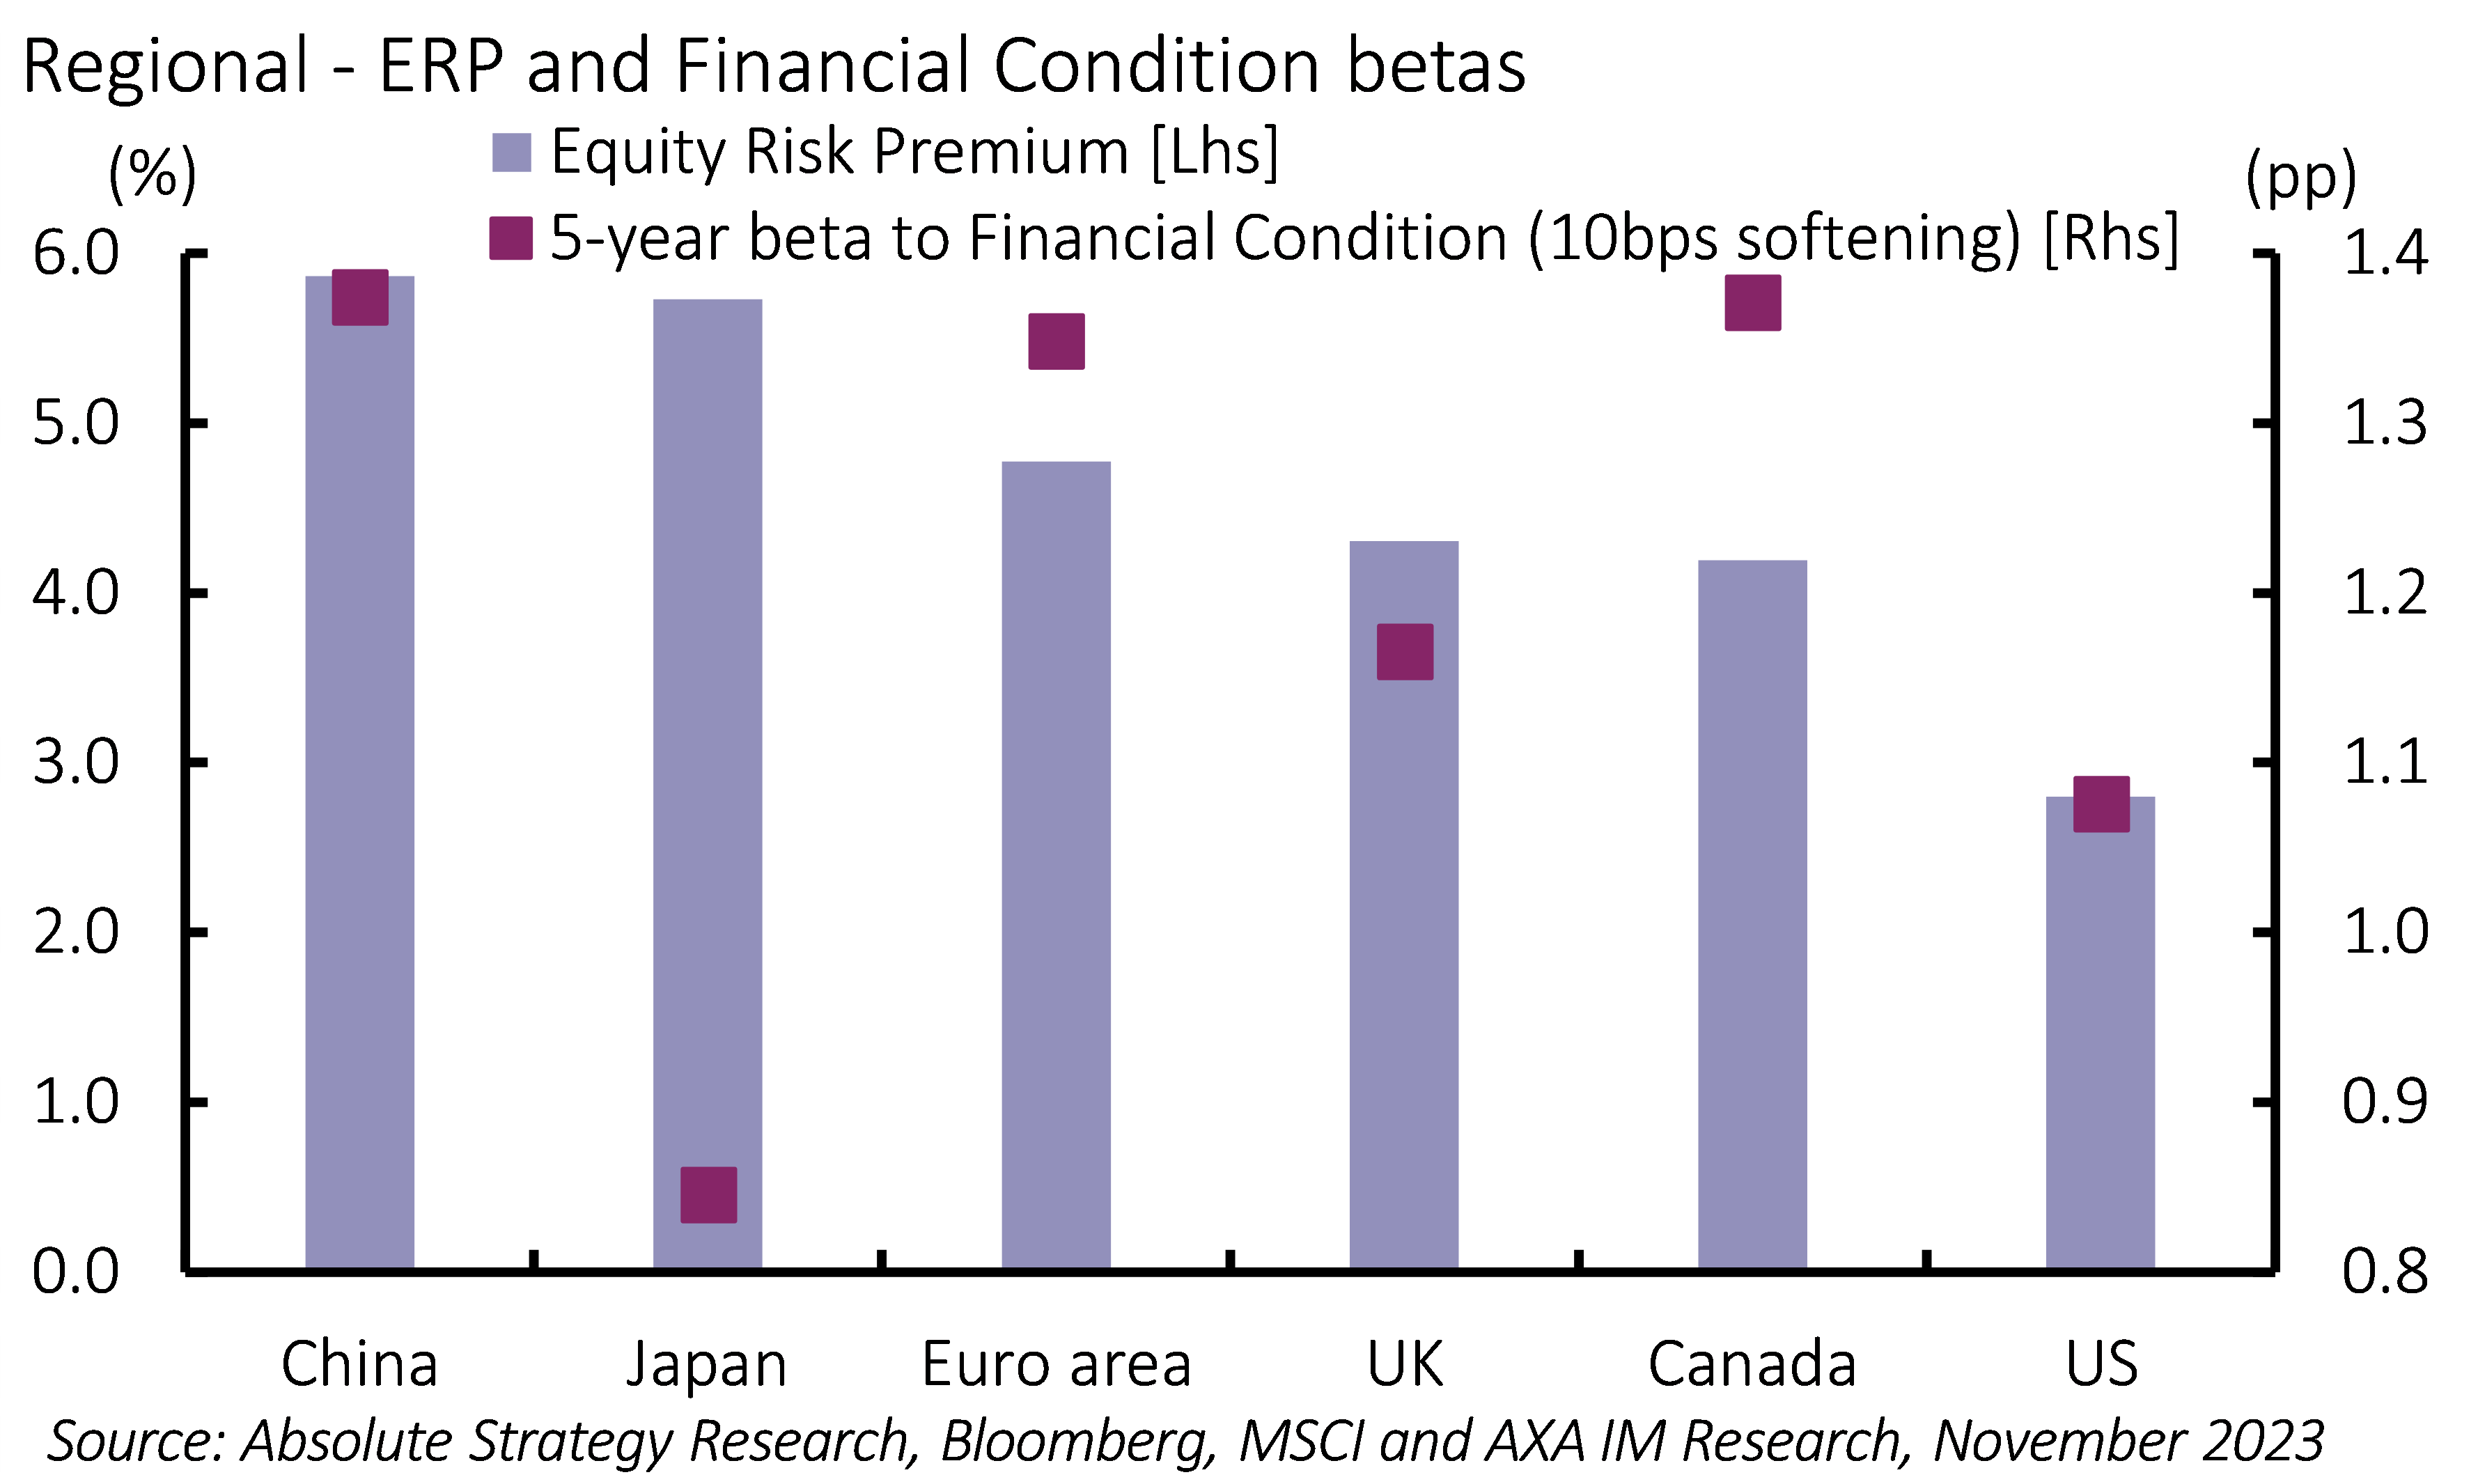
From a broader perspective, we believe Japan can continue to outperform its peers on a purely macro relative basis. Firstly, we expect Japan to deliver above-trend GDP growth and below-target inflation, which is the best combination for equities. Second, it has the second largest equity risk premium across countries and, finally, we see the lowest market price elasticity to tighter financial conditions (Exhibit 4). Insofar as the study is conducted in local terms, the risk of the yen appreciating could erode the returns for international investors.
This last point is not the least important, since credit defaults, fiscal consolidation and higher minimum rates of return could undoubtedly feed a tighter financial condition trend which should be a clear risk to monitor for the equity market.


Disclaimer
This document is for informational purposes only and does not constitute investment research or financial analysis relating to transactions in financial instruments as per MIF Directive (2014/65/EU), nor does it constitute on the part of AXA Investment Managers or its affiliated companies an offer to buy or sell any investments, products or services, and should not be considered as solicitation or investment, legal or tax advice, a recommendation for an investment strategy or a personalized recommendation to buy or sell securities.
It has been established on the basis of data, projections, forecasts, anticipations and hypothesis which are subjective. Its analysis and conclusions are the expression of an opinion, based on available data at a specific date.
All information in this document is established on data made public by official providers of economic and market statistics. AXA Investment Managers disclaims any and all liability relating to a decision based on or for reliance on this document. All exhibits included in this document, unless stated otherwise, are as of the publication date of this document.
Furthermore, due to the subjective nature of these opinions and analysis, these data, projections, forecasts, anticipations, hypothesis, etc. are not necessary used or followed by AXA IM’s portfolio management teams or its affiliates, who may act based on their own opinions. Any reproduction of this information, in whole or in part is, unless otherwise authorised by AXA IM, prohibited.
Neither MSCI nor any other party involved in or related to compiling, computing or creating the MSCI data makes any express or implied warranties or representations with respect to such data (or the results to be obtained by the use thereof), and all such parties hereby expressly disclaim all warranties of originality, accuracy, completeness, merchantability or fitness for a particular purpose with respect to any of such data. Without limiting any of the foregoing, in no event shall MSCI, any of its affiliates or any third party involved in or related to compiling, computing or creating the data have any liability for any direct, indirect, special, punitive, consequential or any other damages (including lost profits) even if notified of the possibility of such damages. No further distribution or dissemination of the MSCI data is permitted without MSCI’s express written consent.