
What is the 2019 Word of the Year?
This time last year we revealed our inaugural Word of the Year. We used our proprietary natural language processing (NLP) framework to analyse trends in the changes in words used during companies’ quarterly earnings calls. These models form part of our systematic assessment of over 20,000 individual companies. Based on this analysis, ‘tariffs’ was our Word of the Year for 2018.
So what have companies been talking about in 2019? Our analysis of the transcripts has revealed that the ‘Word of the Year’ for 2019 is ‘macro’.
Our research has shown that investors across the world became much more focused on economic conditions and their potential impact on business in 2019 than during 2018. What’s more, they are becoming increasingly pessimistic.
The well-documented spat between the US and China over trade across a wide range of goods spooked investors in 2018 and triggered bouts of stock market volatility that continued into 2019.
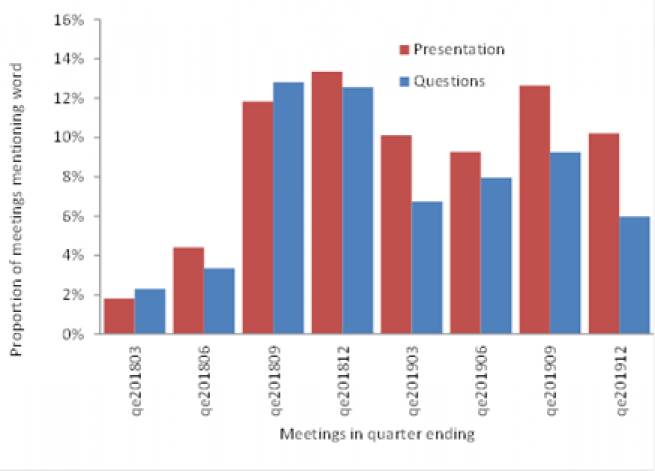
Despite the rhetoric, and the potential for serious trade barriers, the situation never reached crisis point. As 2019 unfolded, while companies were still keen to talk tariffs, they received fewer questions on the topic than they did in the second half of 2018.
As always, some of the biggest jumps were in very specialised words and phrases like ‘Asian swine flu’, ‘Current Expected Credit Losses’ (CECL) and ‘grounding’ – relating to airlines that were severely affected by the Boeing 737 MAX restrictions. But ultimately ‘macro’ topped the charts this year.
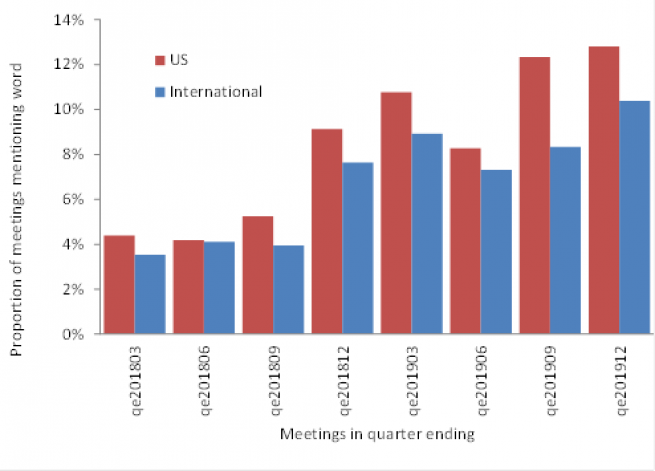
As Chart 2 shows, investors across the world became much more focused on economic conditions in 2019 than during 2018. In the US, the rate of mentions of ‘macro’ rose from around 4% to 12%, with significant growth also in international companies’ calls. Cyclical sectors including materials and industrials saw large increases in their use of the term, but the biggest increase overall was in information technology. Could IT be seeing a return to its historical role as a cyclical industry?
The increased focus on macro themes is reinforced when we look at differences in adjective choices, which indicated that companies and analysts were becoming increasingly pessimistic about the economic outlook as 2019 progressed.
We created simple summaries of five key ‘improvement’ words including ‘high’, ‘improving’ and ‘strong’, and five key ‘worsening’ words include ‘falling’, ‘low’ and ‘weak’. Chart 3 shows a dramatic change since 2018, when companies were enjoying strengthening conditions. This was particularly marked in the US, where tax reforms and a strong macroeconomic background made talk of growth dominant. Even non-US companies followed the same pattern.
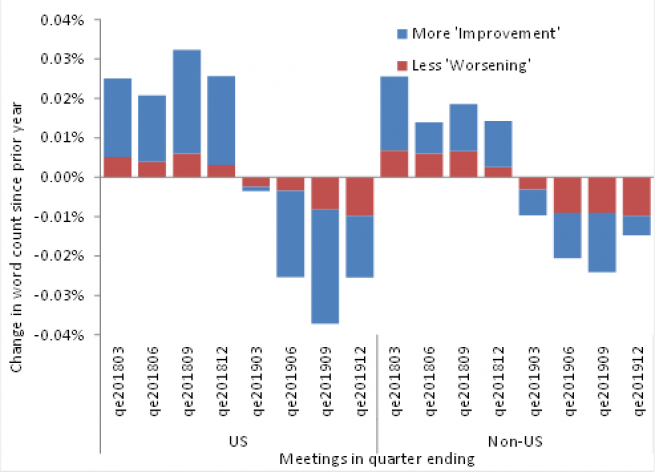
The typical context for the greater discussion of worsening conditions in US company presentations was in phrases like ‘weak market’, ‘weak demand’. There are fewer mentions of ‘improvement’ phrases including ‘stronger financial’, ‘steadily improving’, ‘rising commodity’, ‘improving profitability’ and ‘rising interest’ – the latter reflecting the changed monetary policy environment.
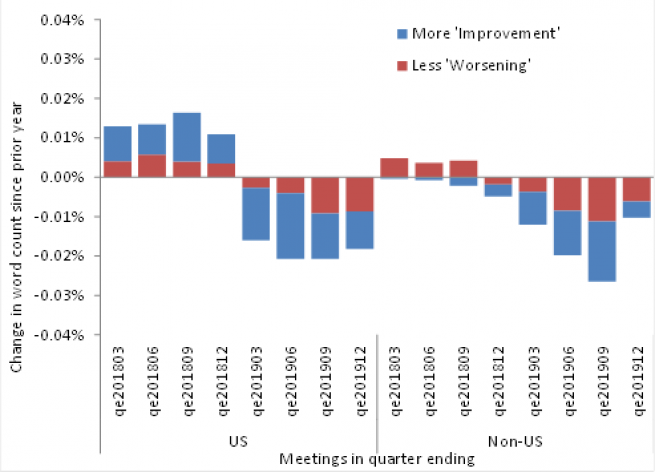
Conference call participants’ questions to company management echoed the same trends, although with less focus on the improved growth during last year, particularly outside the US. Investors may have taken less interest in the strong growth, having decided that it was only temporary.
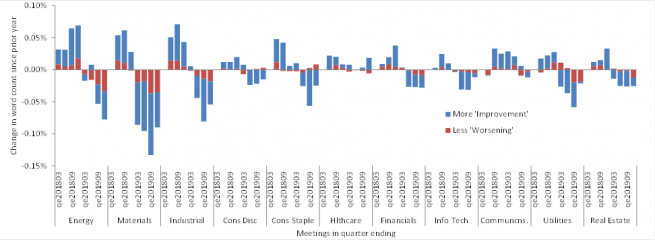
The trend appears to follow a conventional macro-cyclical pattern: Chart 5 shows the analysis of US company presentations’ word count changes, split by sector. Energy, materials and industrials show the biggest swing from more to less discussion of ‘increase’ topics.
Our analysis matches that of our AXA IM Research colleagues, who are forecasting a ‘fragile’ macroeconomic outlook for 2020, followed by a slowdown in 2021. While we agree that ‘tis the season to be jolly, unfortunately it seems that frivolity is not shared by many of the management teams or earnings calls participants included in our NLP analysis. For the time being, macro themes must remain a concern.
Data in Charts 1-5 are based on Rosenberg Equities’ internal investment universe of roughly 20,000 securities. This number of securities analysed for each period varied depending on the number of companies that were in existence and listed at such time and for which earnings calls transcripts were available to Rosenberg Equities.
Disclaimer
This document is for informational purposes only and does not constitute investment research or financial analysis relating to transactions in financial instruments as per MIF Directive (2014/65/EU), nor does it constitute on the part of AXA Investment Managers or its affiliated companies an offer to buy or sell any investments, products or services, and should not be considered as solicitation or investment, legal or tax advice, a recommendation for an investment strategy or a personalized recommendation to buy or sell securities.
It has been established on the basis of data, projections, forecasts, anticipations and hypothesis which are subjective. Its analysis and conclusions are the expression of an opinion, based on available data at a specific date. All information in this document is established on data made public by official providers of economic and market statistics. AXA Investment Managers disclaims any and all liability relating to a decision based on or for reliance on this document. All exhibits included in this document, unless stated otherwise, are as of the publication date of this document. Furthermore, due to the subjective nature of these opinions and analysis, these data, projections, forecasts, anticipations, hypothesis, etc. are not necessary used or followed by AXA IM’s portfolio management teams or its affiliates, who may act based on their own opinions. Any reproduction of this information, in whole or in part is, unless otherwise authorised by AXA IM, prohibited.
This document has been edited by AXA INVESTMENT MANAGERS SA, a company incorporated under the laws of France, having its registered office located at Tour Majunga, 6 place de la Pyramide, 92800 Puteaux, registered with the Nanterre Trade and Companies Register under number 393 051 826. In other jurisdictions, this document is issued by AXA Investment Managers SA’s affiliates in those countries.
In the UK, this document is intended exclusively for professional investors, as defined in Annex II to the Markets in Financial Instruments Directive 2014/65/EU (“MiFID”). Circulation must be restricted accordingly.