
Net Zero Emissions through investments: Road testing a pilot for intermediary target setting
Climate change is providing challenges for investors in every corner of financial markets. Perhaps the most fundamental of these lies in understanding how our portfolios align with the global goals designed to secure sustainable economies deep into the future. Happily, there have been encouraging, concrete and high-profile developments towards this in recent months.
Among these, the United Nations-convened Net-Zero Asset Owner Alliance1, and more recently the Net Zero Asset Managers Initiative2, have seen pioneering steps that could help bring investments in line with the Paris Agreement goal of limiting temperature rises to +1.5°C of pre-industrial levels.
In 2020, as part of the road-testing pilot phase of the Net Zero Asset Owner Alliance, AXA Group and AXA IM worked closely in framing a potential decarbonization framework for corporate fixed income portfolios. And in December, AXA Group came up with its first intermediate target, seeking a -20% decarbonization of investments by 2025 versus 20193. This paper looks at the strategies behind this to develop a proof of concept with some key findings and recommendations.
First, we believe that our simulation of two corporate bond portfolios has offered proof that intermediate targets for investment CO2 footprint reduction of about -16% to -29%, as required by climate science, are achievable.
Second, issuers’ individual climate commitments are a powerful lever to achieve a portfolio decarbonization objective, potentially even more than portfolio allocation shifts towards carbon efficient assets. We believe that data on the scale and scope of emissions commitments from global companies could signal a significant opportunity for investor engagement to secure more ambitious and credible action from the corporate world.
And third, we have seen evidence in this testing that diversification – by sector but also by maturity – can amplify decarbonization potential.
We see a need for more research to confirm and expand on these findings and to enrich the road-testing agenda. The opportunity is there to examine the integration of sector-specific decarbonization pathways, to explore the effect of keeping a certain proportion of investments in green solutions and to refine the integration of companies’ targets in the model by considering the quality of management. And of course, there is the need to test the credibility of transition plans and companies’ decarbonization track records.
- AXA Group joined in November 2019 the Net Zero Asset Owner Alliance, a group of large asset owners committed to reach carbon neutrality through investments by 2050
- In December 2020, AXA Investment Managers joined the Net Zero Asset Managers Initiative
- AXA Group climate corporate communication: https://www.axa.com/en/magazine/AXA-celebrates-the-fifth-anniversary-of-the-Paris-Agreement-and-calls-for-new-commitments
Decarbonization road testing: The scale and nature of decarbonization effects
What does that top-level climate target mean in practice? Based on the IPCC’s 1.5°C pathways with limited or no overshoot (limited use of negative emissions through offsetting strategies), the objective to reach ‘net zero’ carbon neutrality by 2050 can equate to an intermediate asset class-level emissions reduction target range of -16% to -29% from 2020 by 2025. These decarbonization intermediary paths correspond to pathways which relate to ‘low’ or ‘no’ overshoot of the 1.5°C target. These include minimal reliance on carbon dioxide removal technologies. This is considered the “best available” science4.
Decarbonization outcomes can be split into two effects. An allocation effect (or active effect) occurs due to the reinvestment of proceeds from maturing bonds in the best-in-class carbon efficient universe. A selection effect (or passive effect) comes from a company’s expected carbon efficiency gains based on their emissions reduction commitments. We explored these effects in five-year, forward-looking simulations using as starting point two existing corporate bond portfolios.
Portfolio one was a portfolio of euro-denominated bonds with balanced sector diversification, high turnover and large proportion of companies that had made emissions commitments. Portfolio two was a portfolio of US bonds with low sector diversification, low turnover and relatively few committed companies.
These simulations showed us that:
- Coupled with active engagement and thorough selection of issuers based on their climate strategy, we believe an intermediate decarbonization target of between -16% and -29% appears achievable. An 18% reduction in the carbon footprint of investments over the five coming years was achieved in the European fixed income portfolio through selection of the most carbon efficient issuers and given carbon emissions reduction plans set up by investee companies.
- Corporate commitments contribute more than portfolio reallocation to decarbonization potential. Reallocation and portfolio rebalancing (the allocation effect) to the most carbon-efficient issuers does contribute to the overall objective but by half as much as individual carbon efficiency improvements over time (selection effect). This constitutes a great incentive to engage with companies and influence them to take forward-looking decisions that set credible carbon targets.
- Engagement programmes aiming to incentivize commitments would need to focus on carbon-intensive sectors. Indeed, the companies that currently are most committed tend to belong to low-emitting sectors.
- See Rogeli, J. et al (2018) ‘Mitigation Pathways Compatible with 1.5°C in the Context of Sustainable Development’: https://www.ipcc.ch/site/assets/uploads/sites/2/2019/02/SR15_Chapter2_Low_Res.pdf
Decarbonization road testing: Diversification benefits
Another finding from our simulations centred on the role of diversification by sector and bond maturity, both of which showed the potential to amplify the effects of decarbonization.
In terms of sector diversification of portfolios, we found that this can increase the pace of decarbonization. This effect will differ depending on the starting carbon performance of portfolios. A well-diversified portfolio with a significant exposure to sectors at stake in the transition (e.g. energy, transport, industrials), will have more leeway to decarbonize. Naturally, this means that portfolios already well decarbonized, such as focused green strategies, have less upside in terms of carbon efficiency.
European Fixed Income universe, proportion of issuers committed to reduce carbon emissions
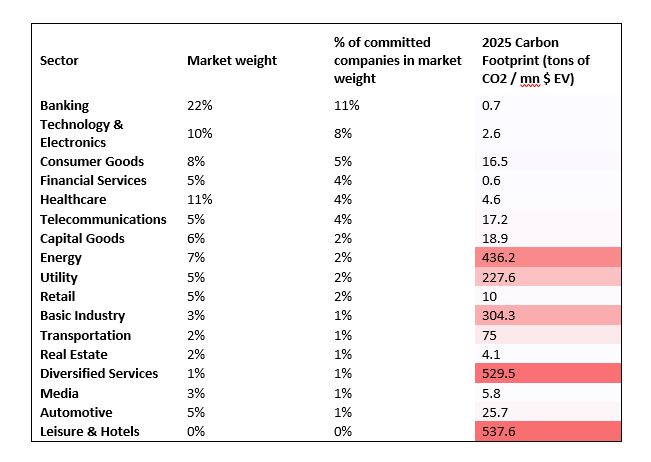
Source : AXA IM, S&P Trucost and MSCI as of 30/09/2020.
In terms of diversification of portfolios by maturities, we found that enhanced portfolio turnover rates can enable a more regular decarbonization potential. In short, the more opportunities to reinvest funds from maturing assets, the more opportunities to put that money to work in assets that serve to decarbonise the portfolio with lower emitting issuers. This turnover effect is also magnified by the proportion of committed companies for each maturity.
These results arise from a buy and hold strategy, where diversification in maturity profile of bonds in portfolio is driving annual cash available for reinvestment. With a high maturities’ diversification strategy, the opportunity would clearly exist to actively manage the portfolio in a way that intensified the selectivity of lower-carbon issuers.
View figures: Portfolio performance: Decarbonization pathway and turnover5
Decarbonization simulations split by effects 2020-2025 on two corporate bond portfolios
| Carbon Footprint: Scope 1 & 2 of GHG emissions by million $ of enterprise value | Variation over five years (in%) | ||||
| 2020 | 2025 | Total | Active effect (reinvestment in less carbon intensive companies) | Passive effect (resulting from companies’ emissions reduction commitments) | |
| Portfolio 1 | 88.5 | 73 | -17.5% | -6.2% | -11.3% |
| Portfolio 2 | 112.5 | 107.5 | -4.4% | -2.4% | -2.0% |
Source : AXA IM
- Annual turnover refers to the amount of cash available through proceeds of maturing bonds
Next steps
The road tests have given us some confidence that the outlined decarbonization of -16% to -29% is indeed feasible, all things equal, within some fixed income universes such as European markets, given the status of issuers carbon performance and climate commitment. There is room though for more research in a variety of areas.
Sector-specific pathways
This exercise has focused on the global decarbonization pathways set out by the IPCC as we head towards 2050. However, climate science has shown that some sectors may have to operate more quickly than the average economy in the short and medium term before carbon neutrality can be achieved. The issues facing hard to abate sectors like basic materials, steel, transportation and other energy intensive industries and sectors at stake in the transition are being addressed by specialist organizations like the Science-Based Targets Initiative (SBTI6), which is bringing scientific measures of the carbon reductions needed from these sectors based on International Energy Agency climate scenarios7.
The energy transition and the power of green investments
We have focused here on decarbonization objectives, but the route to Net Zero is also about supporting the energy transition and invest right now in green solutions. It may be the case that a minimum level of exposure to low-carbon activities could be defined for any investment strategy aligned with the Paris agreement which may ultimately have consequences for the decarbonization agenda.
To this respect, greening of portfolios and asset allocation will benefit from more widely recognized standards like the EU taxonomy. AXA IM has developed an internal proprietary green typology8 organised in four green categories (smart energy solutions, sustainable ecosystems, green buildings and low-carbon transport) which will be directly mapped with the taxonomy once official.
Quality and Engagement
According to the Carbon Disclosure Project, around 40% of companies in the MSCI All Country World Index (ACWI) had disclosed carbon emissions targets as of February 2020. This proportion has doubled since 2015.
MSCI ESG research, however, has highlighted that within the MSCI ACWI universe, carbon targets were generally not very aggressive or demanding. And in terms of testing whether companies are in a position to deliver on their climate objectives, MSCI found that nearly 50% of listed companies globally were not on track with any of their ongoing targets.
While the corporate sector is more and more willing to commit, both the ambition behind those targets and the capacity to deliver remain questionable.
We want to further refine the integration of companies’ targets in the model by considering the quality of management, the credibility of transition plans and the decarbonization track record of the company. To do that effectively, qualitative analysis and assessment of companies progresses through our engagement efforts will be instrumental.
- Ambitious corporate climate action - Science Based Targets: https://sciencebasedtargets.org/
- For now, SBTI well below 2°c (~1.8°C) sector pathways are based on IEA SDS scenario. The IEA has developed the NZE2050 scenario corresponding to a global surface temperature rise limited to 1.5°c but no detailed data especially at sector level are available at that time.
- See AXA IM 2020 TCFD report and the AXA IM 2020 climate strategy report.
Disclaimer
This document is for informational purposes only and does not constitute investment research or financial analysis relating to transactions in financial instruments as per MIF Directive (2014/65/EU), nor does it constitute on the part of AXA Investment Managers or its affiliated companies an offer to buy or sell any investments, products or services, and should not be considered as solicitation or investment, legal or tax advice, a recommendation for an investment strategy or a personalized recommendation to buy or sell securities.
Due to its simplification, this document is partial and opinions, estimates and forecasts herein are subjective and subject to change without notice. There is no guarantee forecasts made will come to pass. Data, figures, declarations, analysis, predictions and other information in this document is provided based on our state of knowledge at the time of creation of this document. Whilst every care is taken, no representation or warranty (including liability towards third parties), express or implied, is made as to the accuracy, reliability or completeness of the information contained herein. Reliance upon information in this material is at the sole discretion of the recipient. This material does not contain sufficient information to support an investment decision.