
Multi-Asset Investments Views: Helter Skelter
KEY POINTS
When I get to the bottom I go back to the top of the slide,
Where I stop and I turn and I go for a ride,
Till I get to the bottom, and I see you again,
Yeah, yeah, yeah, yeah!
“Helter Skelter” - Lennon-McCartney 1968
It’s nigh on impossible to tune out the noise emanating from Washington - ultimate policy intentions have been crowded out by the more nefarious claims that make the headlines on a weekly, and often daily, basis.
We cannot deny the uncertainty on policy direction. Fiscal implications, inflation outcomes and growth prospects are more clouded than they have been at any time since President Donald Trump returned to office.
Financial markets have managed to absorb this uncertainty of late, supported by policymaker back-tracking, and by the President himself, to leave open the possibility that the worst-case scenarios may not be realised.
It might be that we, as investors or economic agents, are just not equipped to fully fathom the genius that lies at the heart of the “art of the deal”. That seems to be the message at least from Treasury Secretary Scott Bessent - that we should collectively trust in the process.
In the meantime, the US economy is proving to be rather resilient as hard data holds up, although admittedly it’s yet to feel the impact of the impending tariff policy adjustment to the terms of trade. The labour market and retail sales are showing no grave signs of concern that might push the Federal Reserve (Fed) to cut interest rates any time soon, despite repeated exhortations from the White House.
Demand was evidently front-loaded to pre-empt the new tariffs regime. This will mechanically lead to softer numbers ahead but evidence of any underlying weakening of the economy is yet to materialise. The soft data remains weak, especially data from National Federation of Independent Business (NFIB) on small business confidence, which is historically closely linked to the outlook for employment.
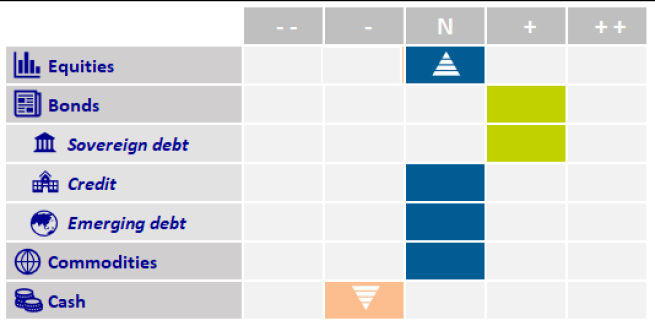
If anything, the gap between hard and soft data has closed over the month from both ends. To add to this, a decent earnings season and an all-pervasive fear of missing out moment, as an extreme positioning underweight in equities from April’s gyrations has reverted to near neutral now, and we can explain, if not fully understand, the strength of the rebound. In the face of such a strong move, we increased exposure to risk assets and re-positioned strategies back to a long-term neutral stance.
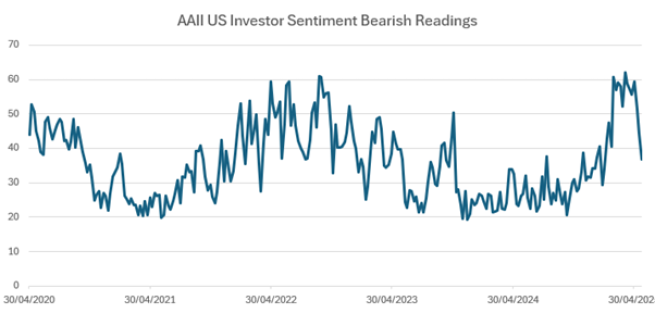
Of particular note has been the evolution of the American Association of Individual Investors’ bull-bear index (below) which, following a record-breaking period of 11 consecutive weeks in bear market territory, has dramatically flipped back to a positive stance for the first time since January. Yet, this suggests a disconnect – or perhaps complacency – between investor confidence and the near-certain deterioration in the economic outlook, as rising uncertainty weighs on economic agents’ expectations for future activity, terms of trade, and investment policy.
Elsewhere, the US dollar remains one of the few major market indicators, along with the price of oil, that has yet to recover from April’s stress potentially signalling deeper concerns around US assets and declining foreign appetite for them.
While the damaging spiral of rising US yields, falling equities, and a weakening dollar appears to have been broken, pre-2007 experience suggests the dollar is unlikely to stage a meaning rebound if the term premium on US Treasuries continues to rise. This is further complicated by a Fed that remains biased toward rate cuts, despite the un-anchoring of near-term inflation expectations, as reflected in the University of Michigan survey, which now places one-year ahead inflation at over 7%.
This underscores a clearer warning: further equity market gains may be constrained by the deteriorating US fiscal outlook and its likely expression through the yield curve. Recent moves have seen long yields moving higher on the steepening of curves, and this is not confined to the US but also, and more violently, on the Japanese Government Bond (JGB) yield curve. While not necessarily related, as Japanese life insurance companies are generally showing less appetite for duration currently, the combined un-anchoring at the long end of both yield curves (along with UK Gilts) will likely put negative pressure on equity markets’ relative attractiveness, as we have previously described with the ‘Danger Zone’ model for 10-year US Treasury yields.
That relationship is currently 20 to 25 basis points from signalling anything more concerning which, in recent market experience, is not terribly far from here. Term premium in the US treasury market has increased dramatically in recent quarters but remains at the lower bound of the range that prevailed in markets prior to 2007.
In the absence of any dramatic change to the US fiscal outlook and with supply set to remain elevated, the attractiveness of US debt and the US dollar with it, will be a challenge for investors. While we largely prefer Bunds to Treasuries, they do not provide a realistic alternative for international investors in terms of market size and, in this regard, the adjustment in prices required to compensate for deteriorating debt dynamics and a weaker dollar will have broader consequences for global markets. And so, back to the top, so long as the US economic engine continues to prove its exceptional resilience.


Disclaimer
This document is for informational purposes only and does not constitute investment research or financial analysis relating to transactions in financial instruments as per MIF Directive (2014/65/EU), nor does it constitute on the part of AXA Investment Managers or its affiliated companies an offer to buy or sell any investments, products or services, and should not be considered as solicitation or investment, legal or tax advice, a recommendation for an investment strategy or a personalized recommendation to buy or sell securities.
Due to its simplification, this document is partial and opinions, estimates and forecasts herein are subjective and subject to change without notice. There is no guarantee forecasts made will come to pass. Data, figures, declarations, analysis, predictions and other information in this document is provided based on our state of knowledge at the time of creation of this document. Whilst every care is taken, no representation or warranty (including liability towards third parties), express or implied, is made as to the accuracy, reliability or completeness of the information contained herein. Reliance upon information in this material is at the sole discretion of the recipient. This material does not contain sufficient information to support an investment decision.
Issued in the UK by AXA Investment Managers UK Limited, which is authorised and regulated by the Financial Conduct Authority in the UK. Registered in England and Wales, No: 01431068. Registered Office: 22 Bishopsgate, London, EC2N 4BQ.
In other jurisdictions, this document is issued by AXA Investment Managers SA’s affiliates in those countries.
© 2025 AXA Investment Managers. All rights reserved
Image source: Getty Images