
Monetary policy and the market-based R-star
KEY POINTS
An interest rate which cannot be observed
Conceptually, we can decompose the yield on a risk-free bond into four parts - the natural interest rate (aka ‘r-star’), monetary policy anticipation, expected inflation and risk premiums. However, the interplay between markets and central banks on the topic of the so-called ‘r-star’ – and its effect on monetary policy’s stance, bond yields and risk premia - is an intricate one.
In 2002 economists Thomas Laubach and now-New York Federal Reserve (Fed) President John Williams defined the modern view of r-star as “the real short-term interest rate consistent with output converging to potential, where potential is the level of output consistent with stable inflation”.1
More simply, it is often referred to as the short-term interest rate which would prevail when the economy is at full strength and inflation is stable.
Figure 1: US natural rate of interest estimates
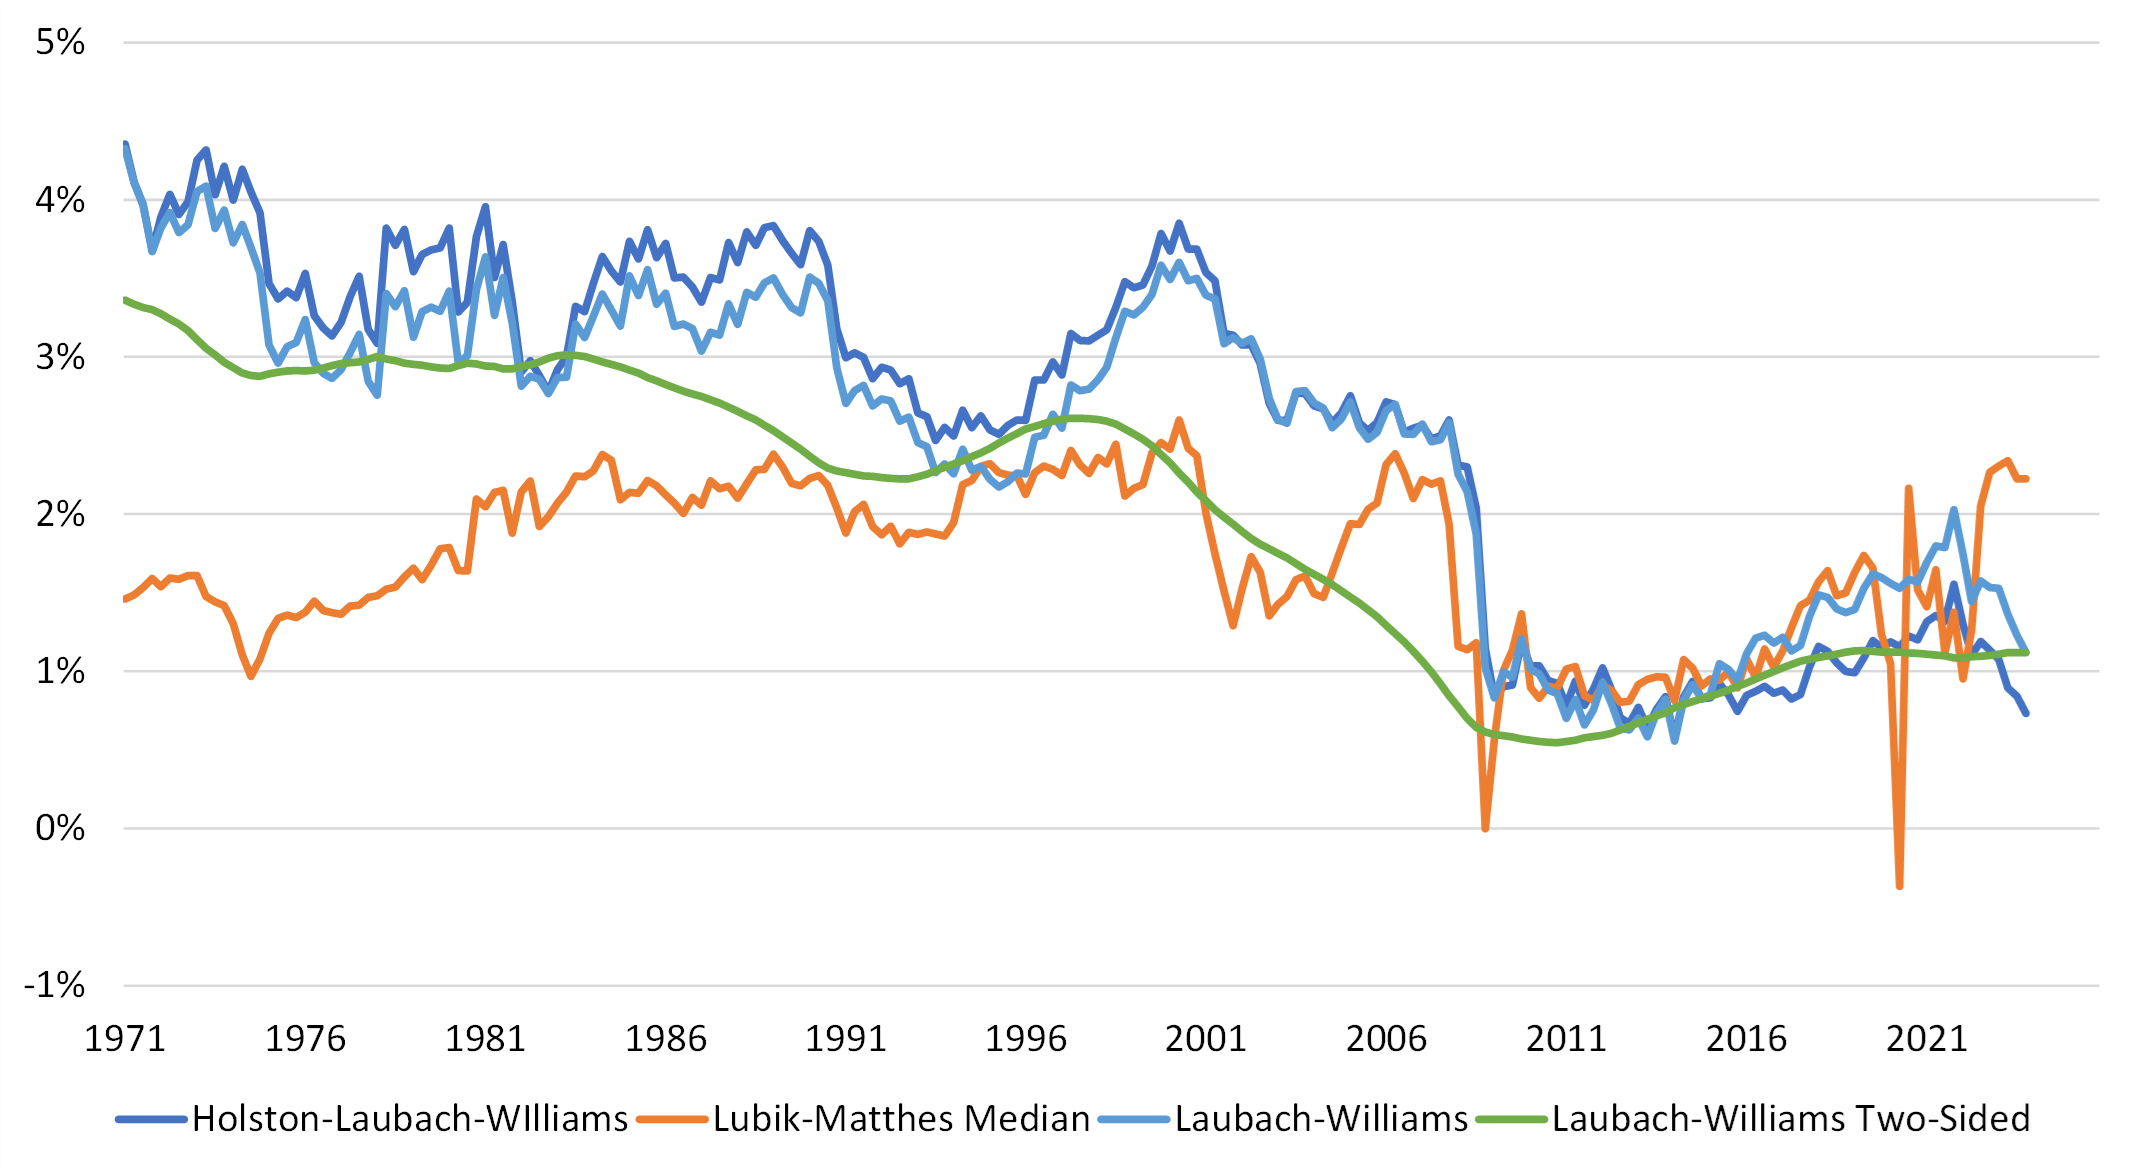
Source: Bloomberg
The Fed publishes several estimates of r-star - see Figure 1. Note the wide dispersion in most recent estimates, from 0.75% to 3.1%. A similar range can be observed in Eurozone estimates which were recently published by the European Central Bank. Also, note r-star’s dynamic nature, averaging 2.5% from 1970 to 2002 before dropping to as low as 0%-0.5% in 2009 and to a similar level in the aftermath of the pandemic shock.
- {https://www.dallasfed.org/research/economics/2023/0703#:~:text=Economists%20Thomas%20Laubach%20and%20now,output%20consistent%20with%20stable%20inflation.%E2%80%9D;Gazing at r-star: Gauging U.S. monetary policy via the natural rate of interest - Dallasfed.org}
The yield curve comes to the rescue
Luckily for financial markets practitioners, yield curves are an invaluable source of information as they immediately discount complex scenarios at any forward date. For example,
the forward interest rate market allows us to construct a market-based estimate of the r-star. The implied one-month interest rate in five-years’ time gives us an approximation of the future equilibrium policy interest rate expected by market participants. Adjusting this by subtracting an estimate of the term premium (the additional return required on lending for longer periods) gives us an estimate of the nominal r-star rate.(See Figure 2).
Figure 2: Model and market-based r-star
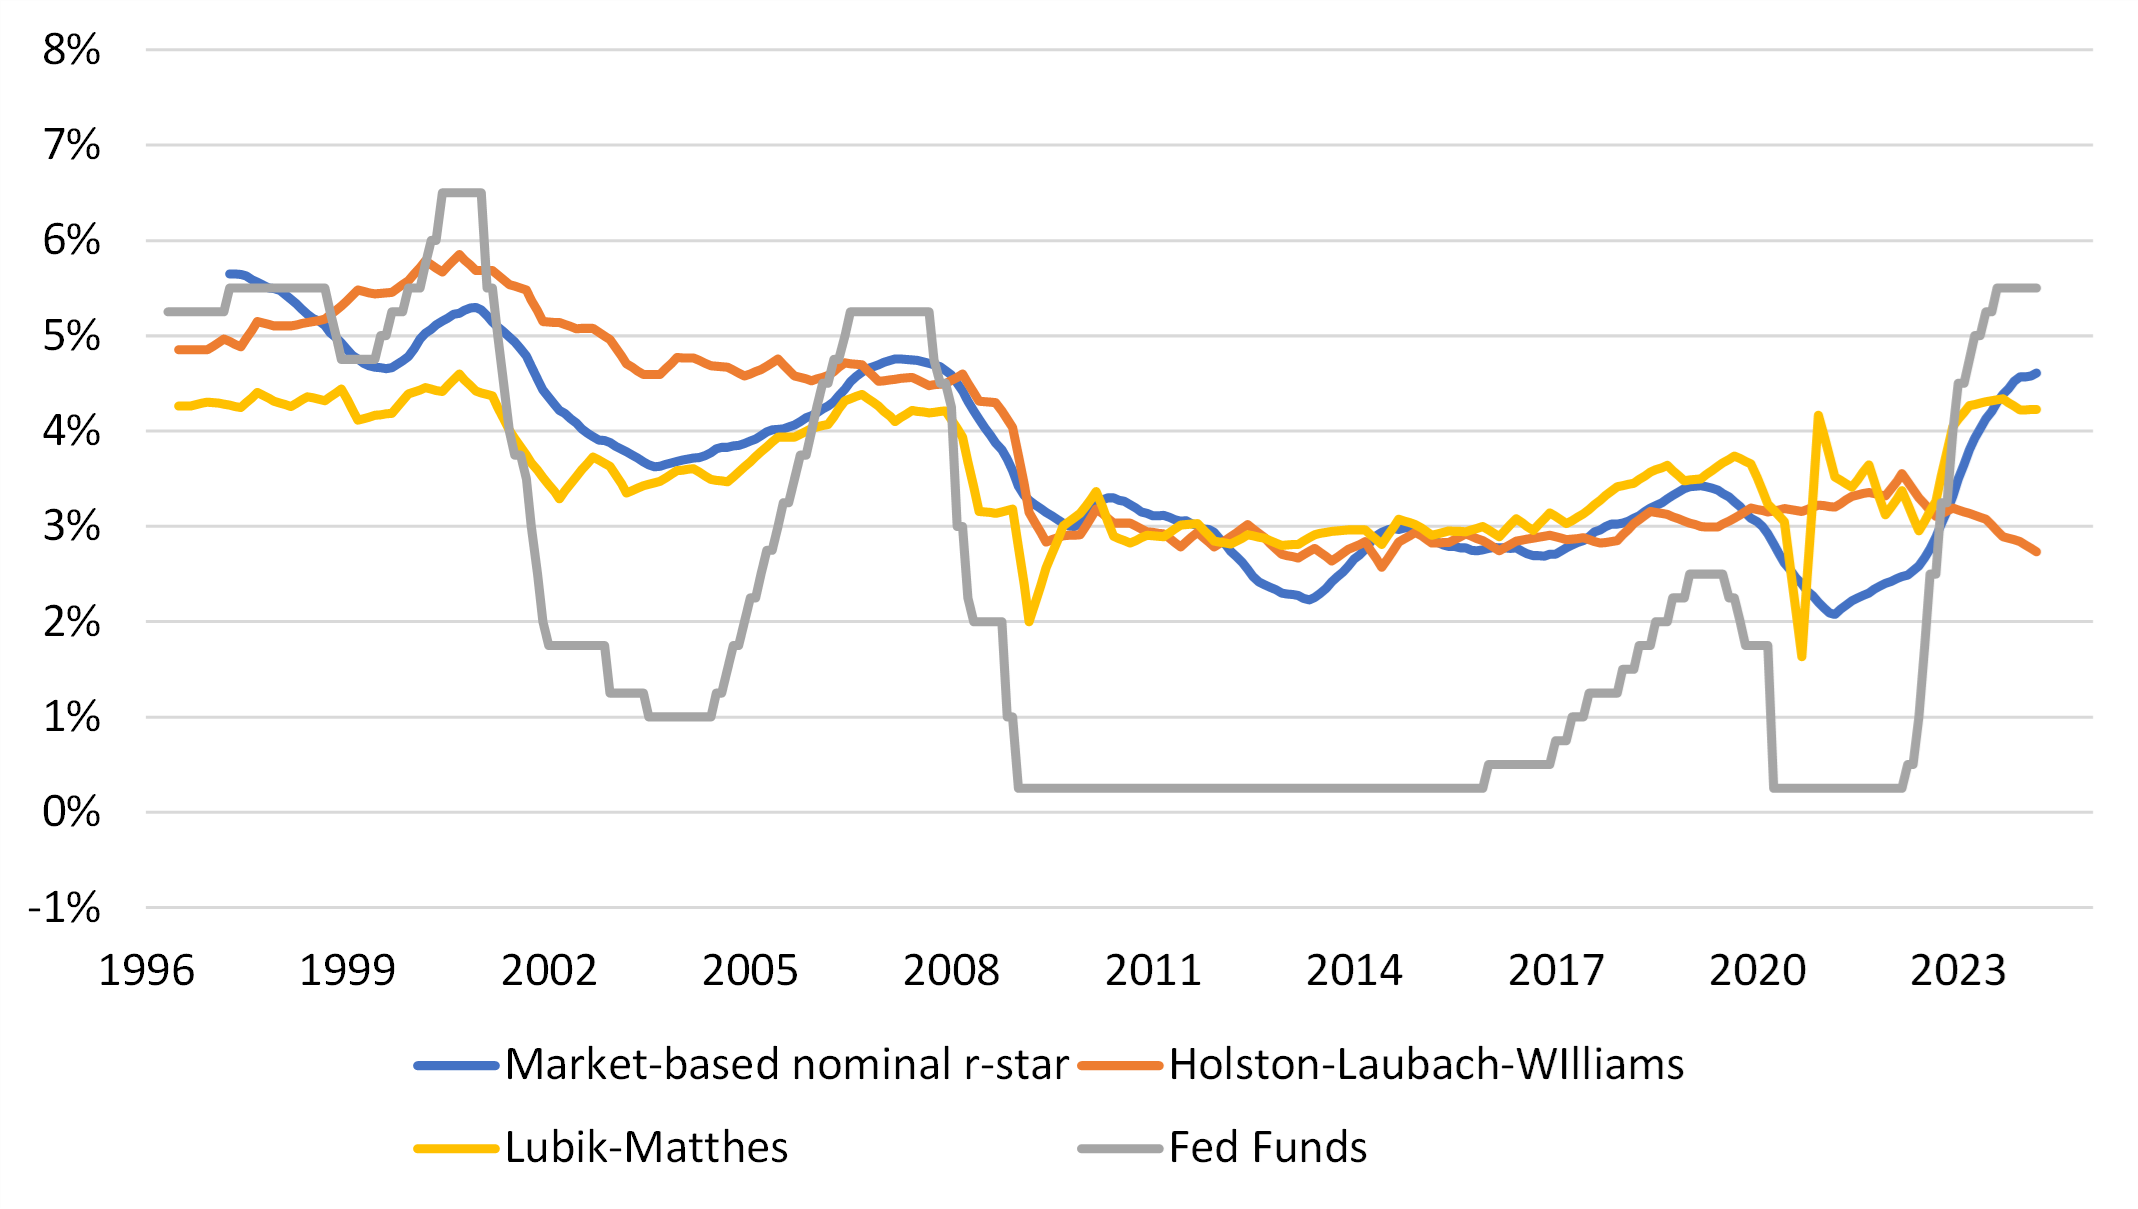
Source: AXA IM, Bloomberg
Four aspects are worthy of note:
- There is a substantial 140 basis points (bp) gap between model-based estimates. While this is entirely due to different statistical methodologies, it does highlight the level of uncertainty about the true value of this metric
- Our market-based r-star measure seems to better reflect the Lubik-Matthes estimate2, both in terms of regimes as well as dynamics. By construction, this model-based estimate of r-star is derived from potential growth
- At around 4.5%, our market-based r-star is now 170bp above the 2009-2019 average level.
- It’s not clear how monetary policy and hence market-based r-star measures ultimately influence the true but unobservable level of r-star. Economist Gianluca Benigno (2024)3 raises the possibility that – while generally assumed to be neutral in the long-run – monetary policy “has at least very long-lasting effects on real variables”. Adding expansionary fiscal policy to a decade of quantitative easing (QE) might eventually influence the allocation of resources and productivity
Figure 3: Factors affecting US Treasury yields
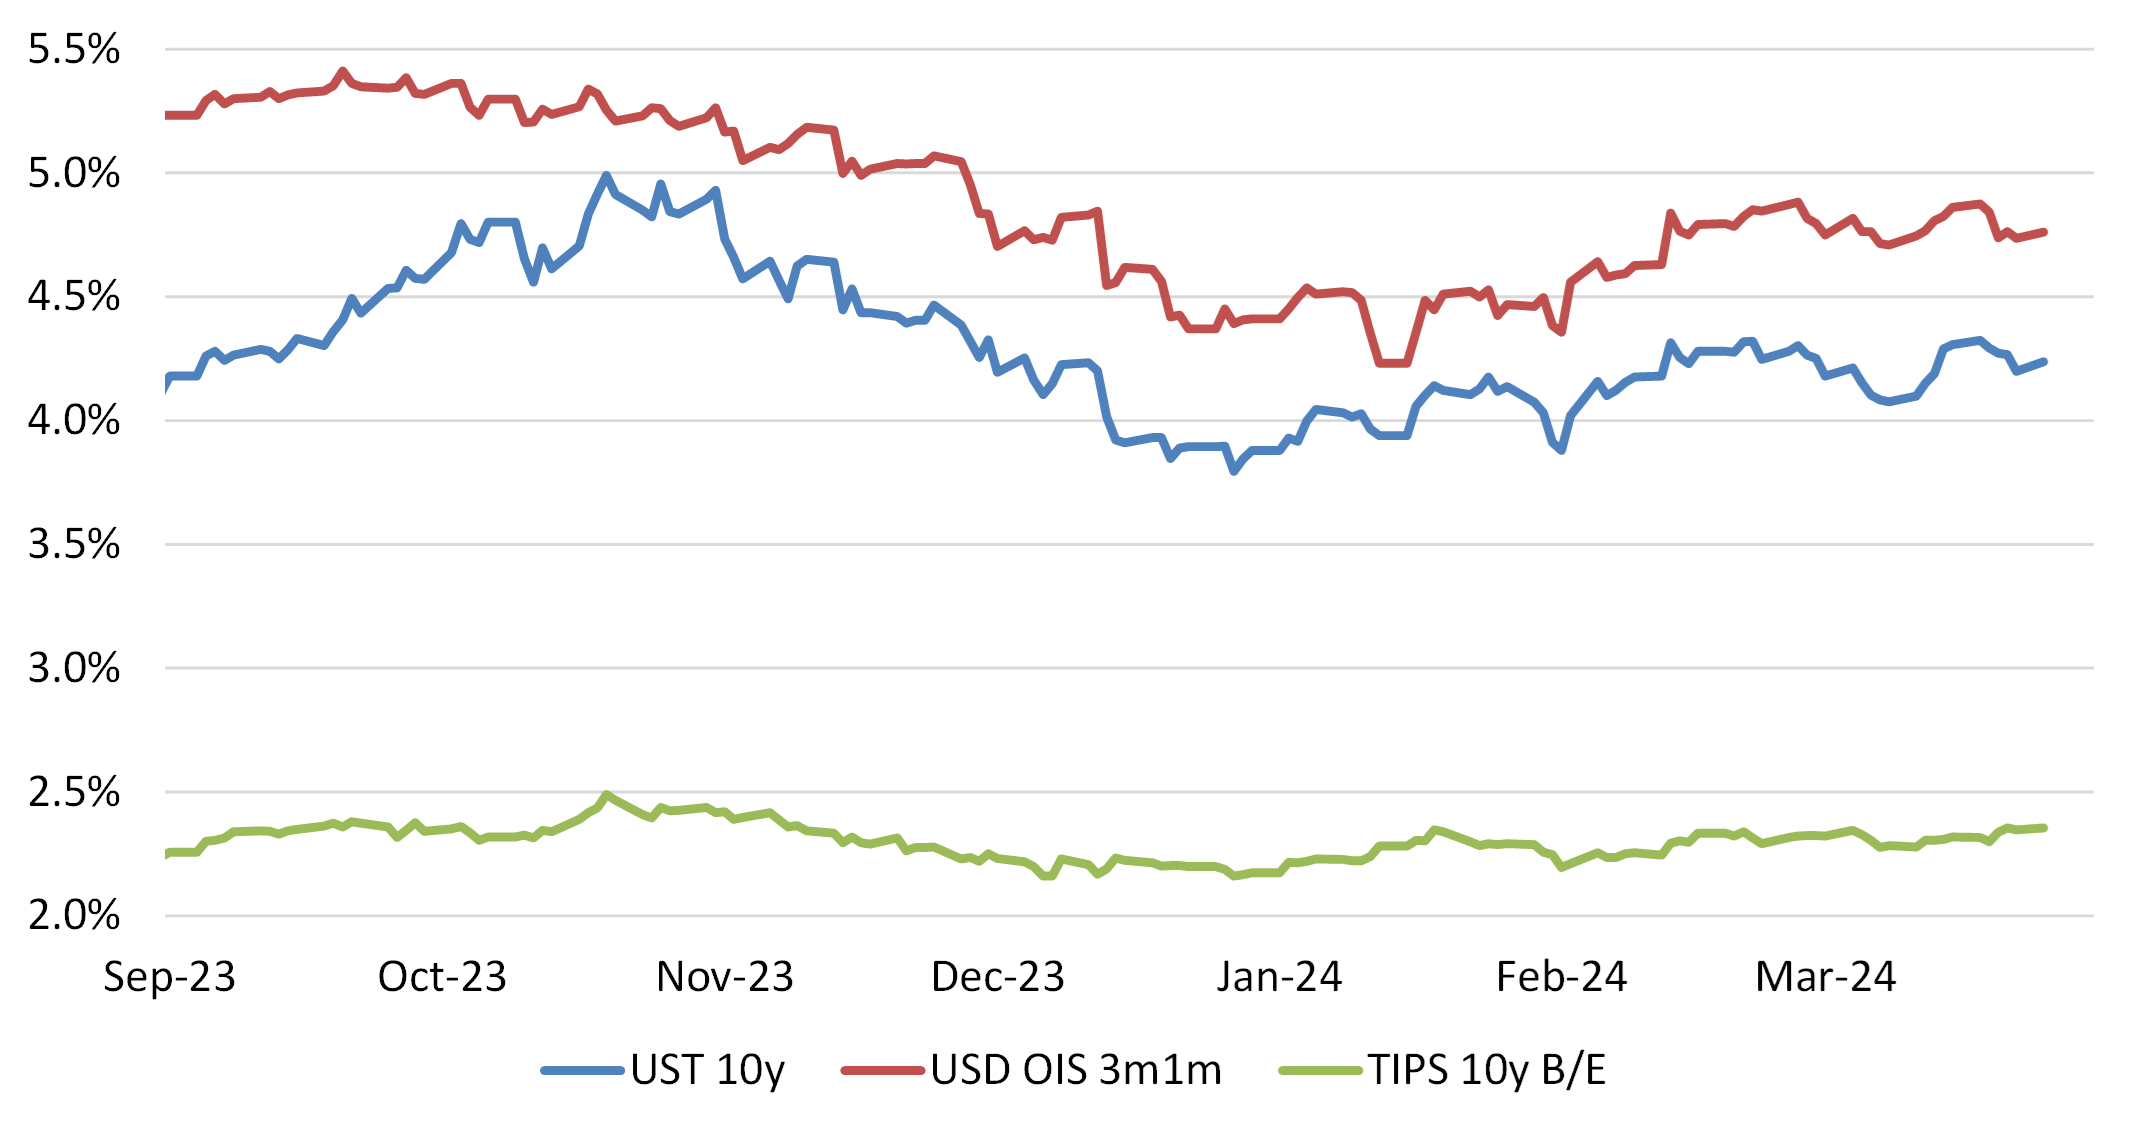
Source: Bloomberg
- {https://www.richmondfed.org/research/national_economy/natural_rate_interest;Lubik-Matthes Natural Rate of Interest | Richmond Fed}
- {https://www.bis.org/publ/qtrpdf/r_qt2403b.htm;Quo vadis, r*? The natural rate of interest after the pandemic (bis.org) Benigno, Hofmann, Nuño Barrau and Sandri}
Policy uncertainty = Higher risk premium
The high level of uncertainty around r-star automatically translates into uncertainty about the monetary policy stance. Again, we can refer to an example from the Fed’s past, when measurement errors did ultimately bias its perception to the point of erroneously calibrating monetary policy at the end of the 1960s. The high and volatile inflation during the 1970s might have been partially avoided “if the Federal Reserve had possessed excellent information regarding the structure of the economy”.4
The parallel with today’s markets can be easily drawn - what if the natural interest rate was higher than current estimates? What if the long-run dot (r-star) at 2.6% failed to capture the changing structure of the economy? Evidently, the actual monetary policy stance would not be as tight as is widely believed, in which case risk premia across asset classes are probably too compressed to compensate investors for a scenario of repricing of a new interest rate regime.
In practical terms, it is likely the current level of the Fed Funds Rate is above most estimates of the r-star. Hence, policy is restrictive and inflation appears to be heading lower. This justifies market expectation of some easing of policy in the year ahead. However, the message from central bankers – perhaps reflecting their own internal discussions about the neutral rate – is that markets need to be careful about pricing in too many rate cuts. This in turn has implications for expected returns across bond markets and is a strong support for short-duration strategies in fixed income, given that yields curves are inverted and thus pricing in much lower rates in the future.
- {https://www.frbsf.org/wp-content/uploads/wp10-12bk.pdf;Orphanides/Williams (2010)}


Disclaimer
This document is for informational purposes only and does not constitute investment research or financial analysis relating to transactions in financial instruments as per MIF Directive (2014/65/EU), nor does it constitute on the part of AXA Investment Managers or its affiliated companies an offer to buy or sell any investments, products or services, and should not be considered as solicitation or investment, legal or tax advice, a recommendation for an investment strategy or a personalized recommendation to buy or sell securities.
Due to its simplification, this document is partial and opinions, estimates and forecasts herein are subjective and subject to change without notice. There is no guarantee forecasts made will come to pass. Data, figures, declarations, analysis, predictions and other information in this document is provided based on our state of knowledge at the time of creation of this document. Whilst every care is taken, no representation or warranty (including liability towards third parties), express or implied, is made as to the accuracy, reliability or completeness of the information contained herein. Reliance upon information in this material is at the sole discretion of the recipient. This material does not contain sufficient information to support an investment decision.
Issued in the UK by AXA Investment Managers UK Limited, which is authorised and regulated by the Financial Conduct Authority in the UK. Registered in England and Wales, No: 01431068. Registered Office: 22 Bishopsgate, London, EC2N 4BQ.
Image source: Getty Images