
COVID-19 update: US policy response
- 03 June 2020 (15 min read)
The effectiveness and impact of the US policy response
- US authorities have provided an unprecedented package of support measures in response to the pandemic.
- The government has enacted $2.7tn of front-loaded fiscal stimulus. This stimulus should deliver an 8.6ppt boost to GDP in 2020, with little spilling into 2021.
- The Federal Reserve (Fed) cut the Fed Funds Rate by 150bps and has bought $2.3tn of assets to expand the balance sheet by $2.6tn in just over two months. This should boost growth over the medium term, and we estimate a boost of around 0.3 percentage point in 2020, 1.5-2.5% in 2021 and 0.5-1.0% in 2022.
- The Fed and Treasury have in tandem also put in place measures to provide $2.3tn of lending programmes to support markets and borrowing in the wider economy.
- Despite this large-scale stimulus, we estimate US GDP growth to close next year some 1.7% lower than the trend path of expansion – before threatening elevated unemployment and inflation below the Fed’s target.
- We argue that this is likely to require even more fiscal and monetary stimulus over the coming months. We believe the difficulty will be to maintain the effectiveness of fiscal stimulus on a par with the stimulus to date.
Part of a global policy response
The international policy response to the severe shock that the COVID-19 pandemic has delivered to the global economy has been immense. Total fiscal stimulus has exceeded $8tn, while international central banks have made 139 separate policy rate cuts1 so far this year, started (or restarted) balance sheet expansion and engaged in other liquidity supporting measures or other credit backstop policies. In a series of papers, we will first consider the US policy responses, before in subsequent papers looking at the major economies of China, Japan and across the Eurozone.
The US has been at the forefront of this policy stimulus. The Federal Reserve (Fed) was the first developed market central bank to ease monetary policy in response to this crisis. It has subsequently cut rates to 0-0.25% – its effective lower bound. The Fed has also expanded its balance sheet by $2.6tn to $6.9tn in the space of two months, moving further and faster than during the financial crisis, including purchasing $1.6tn of US Treasury securities (UST) and $680bn of mortgage-backed securities (MBS). At the same time, the federal government has so far committed $2.7tn in fiscal stimulus (12.5% of GDP), including the $2tn Coronavirus Aid, Relief, and Economic Security (CARES) Act stimulus. It is actively debating whether to provide a fourth round of stimulus, with House Democrats pushing for a further $3tn (14% of GDP). Moreover, the Treasury and Fed have acted together – the former providing capital to the latter – to roll out $2.3bn of Fed lending measures to backstop a range of credit markets and enhance lending by private sector lenders (Exhibit 1).
In this note we look at a breakdown of these policies. We consider the scale and effectiveness of each of the policy measures, then estimate the impact it will have on GDP and when that impact is likely to fall. This will provide us with an indication of the economic boost delivered by policy to date and provides some way to gauge the scale of future policy stimulus that is likely and could be required.
$2.7tn of fiscal stimulus and counting
As described, the federal government has announced spending decisions worth $2.7tn over the past two months. In what follows, we show that most of those measures ($2tn) are likely to be disbursed in the present quarter, with most of the rest either already disbursed in the first quarter (Q1) or to be followed up in Q3. Exhibit 1 illustrates our estimated disbursement of government spending promises.
Around $575bn of the announced spending was for direct pandemic response measures. This included the initial $8.3bn of the Emergency Coronavirus Response Act (ECRA) on 6 March, around $60bn of the Families First Coronavirus Response Act (FFCRA) on 18 March and $430bn of the CARES Act on 27 March, with $150bn direct to public health and $275bn to fund state and local governments’ COVID-19 response. Finally, an additional $75bn was earmarked for hospitals and health spending in the 24 April Interim Stimulus measure. We assume this has been spent quickly and fully.
The CARES Act included $560bn for individuals. $260bn of this topped up unemployment benefits by $600 per week until 31 July2 . This roughly accounts for 25mn new claimants until then and on our estimates, unemployment will not average this high level over that period – though it has reached it in the latest weeks – leading to some shortfall in expenditure here. The Treasury is also in the process of mailing checks to individuals, having disbursed electronic payments. It had disbursed an estimated $200bn by 8 May and although checks were due to be mailed into Q3, the bulk of this $300bn will be distributed in Q2. However, households may have limited opportunity – or desire – to spend these payments immediately, beyond essentials. We assume that household saving rates will rise sharply in Q2 but should begin to normalise from Q3.
Another large component was the Payrolls Protection Program (PPP) and other smaller loan supports to small businesses. The first round of PPP loans – $349bn – was exhausted by mid-April. This resulted in a top-up of $310bn on 24 April. As of 12 May, over half – $191bn – had already been committed and we see a good chance that the rest will be used in Q2, with loans becoming grants based in part on end-June employment levels.
The remaining fiscal measures that we assume will trickle out over subsequent quarters are associated with the Treasury capital to backstop further Fed lending. The Treasury has allocated $195bn of this to the Fed to backstop the $2.3tn in programmes it has already announced. US Treasury Secretary Steven Mnuchin stated on 19 May to the Senate Banking Committee that he intended to make full use of monies allocated to him. However, with Fed Chair Jerome Powell explaining that the Fed’s authority for these new lending programmes3 was granted by the Treasury in exceptional circumstances, it is not clear that the Fed will ramp up lending measures over the medium-term. However, these funds may also be used to account for credit losses that the Fed may accrue through these schemes over time.
We suggest that in the main this stimulus has been well targeted and timely. Although most of the ultimate spending decisions will be down to third parties, much of the spending is likely to be associated with a relatively high fiscal multiplier and we suggest is likely to be spent relatively quickly. This should provide some cushion to the economy and is in part why we expect such a sharp rebound in Q3 – pencilling in an 8% quarter-on-quarter (qoq) pick-up following a sharp 10%qoq drop in Q2.
Monetary policy
The Fed has been characteristically swift to lend monetary support to the economy. The Fed was the first developed economy central bank to respond to the impending pandemic, cutting its Fed Funds Rate (FFR) by 50 basis points (bps) to 1.00-1.25% on 3 March. It followed this up 13 days later with a further 100bps rate cut, taking policy to its effective lower bound of 0-0.25%. However, the Fed’s rate easing has been constrained in comparison with previous downturns. The last three downturns each saw the Fed cut rates by over 500bps. However, because nominal rates were already low at the start of this shock, the Fed did not have the conventional policy space to repeat this scale of easing.
We can be relatively confident about the impact of conventional policy easing in the economy, given estimates of previous cycles. Exhibit 2 illustrates the simulated impact of the 150bps easing the Fed has enacted – on top of last year’s more gradual easing – in boosting growth4 . Monetary policy lags mean that Fed easing should not be expected to meaningfully boost growth until 2021. We also note the difference in terms of growth impact between the Fed’s current easing and its historic recession response of 500bps. We provide two illustrative scenarios – the first if the Fed had cut rates by 500bps over the same timeframe as current reductions. The second is if it took the average time taken to reduce policy rates in the past three downturns.
At the same time as reducing the FFR, the Fed restarted its quantitative easing (QE) programme on 16 March, announcing $700bn of long-term security purchases, $500bn in USTs and $200bn in MBS. days later it removed these limits and announced it would be buying “as needed”. To date, the Fed has bought $1.6tn of USTs and $0.66tn of MBS. The balance sheet has expanded by $2.6tn over two months. This compares to a peak balance sheet expansion of $2.4tn over just over five years after the financial crisis (2009-2014) where the Fed bought $1.8tn in UST and MBS. The Fed’s motivation for this rapid balance sheet expansion was to restore and maintain orderly markets – Treasury and others – rather than monetary stimulus. However, with the Fed unlikely to reverse its holdings in the short term, the balance sheet expansion will also have a monetary effect.
Estimating the stimulative effect of balance sheet expansion is not so easy. Academic research in the wake of the financial crisis5 6 estimated the approximate equivalent FFR adjustment for a given amount of asset purchases. Using the average of these two approaches we can estimate the boost to GDP that balance sheet expansion to date – and expected continuation until early 2021 – would deliver to the economy (Exhibit 3).
This suggests that the lion’s share of stimulus to the US is likely to come from the Fed’s balance sheet expansion, although as another form of monetary policy it is also likely to work with a lag. However, QE is thought to impact the economy by depressing long-term yields. During the financial crisis, 10-year UST yields fell by about 230bps. Since January UST yields have fallen by around half that amount to about 0.70% at the time of writing. The relatively smaller drop in yields may limit the effectiveness of QE in stimulating the broader economy, something we also illustrate.

Credit backstops
The final element of US stimulus has come from a number of lending programmes that the Fed announced to backstop lending in different areas. These started with the reactivation of schemes last seen during the financial crisis, including the Primary Dealer Credit Facility (PDCF), swiftly followed by a Term Asset Lending Facility (TALF), Money Market Liquidity Fund (MMLF) and Commercial Paper Financing Facility (CPFF). The Fed also enacted Primary and Secondary Market Corporate Credit Facilities (PMCCF and SMCCF) – new schemes enabling the Fed to purchase investment grade (IG) rated corporate bonds7 or exchange-traded funds (ETFs) designed with broad exposure to corporate bonds. All of these schemes were announced on 23 March. However, on 9 April the Fed extended their size and scope by establishing special purpose vehicles, backed by $195bn of Treasury capital (of the $454bn set aside for this purpose) to cover credit risk and expected losses. The Fed also announced a Paycheck Protection Program Liquidity Fund (PPPLF), Main Street Lending Facility and Municipal Liquidity Facility.
The announcement of this suite of measures was billed as allowing $2.3tn of lending to the economy. The reality has been slower. Not all of the programmes announced are yet underway. At the time of writing, MMLF, CPFF, PDFC, PPPLF and some initial ETF purchases under SMCCF have begun. Other schemes including the full roll out of the CCF, TALF and Main Street program are still in the planning stage. Total assets held under these programs was just $95bn. Exhibit 4 illustrates the Fed’s use of these facilities to date.
Nevertheless, even the announcement of these schemes has been sufficient to see meaningful improvement in underlying funding markets. The LIBOR-OIS spread reached its peak in the days after the announcement of the extension of the Fed’s schemes towards the end of March. Meanwhile the peak in the spread between commercial paper and T-bills hit a peak on 24 March – despite the fact that the Fed did not start buying commercial paper until mid-April. Exhibit 5 illustrates how prime MMF outflows also stopped soon after the Fed’s announcements, while municipal MMFs also saw a reversal of outflows almost immediately after, followed by a swift cessation of fresh inflows into safer government MMFs.
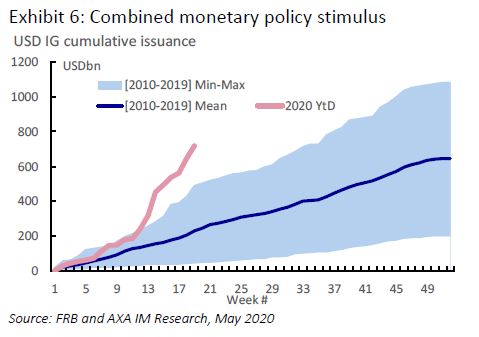
The same can be said of the Fed’s corporate credit facilities. These have to date only seen very small, and recent – starting 14 May – purchases of corporate bond ETFs. However, US IG and high yield corporate spreads peaked in the week of 20 March and have fallen back in each subsequent week. Moreover, Exhibit 6 illustrates how debt issuance – already elevated as firms saw increased cash needs – has risen sharply thereafter.
The purpose of the Fed’s lending programmes has not been stimulus per se, but to restore orderly conditions to financial markets to avoid market dislocations and minimise any tightening in financial conditions. Preliminary evidence suggests that, even with minimal outlay, they – and the Fed/Treasury lending programmes - have achieved that in most funding markets. However, it is too early to be definitive about the broader impact. The Fed’s latest Senior Loan Officers Survey (SLOOS) showed a material tightening in lending conditions for large to small commercial and industrial firms and to households for credit cards (Exhibit 7). Admittedly, the survey was conducted between 23 March and 3 April – across the height of the funding difficulty. One measure of success of the Fed’s lending programmes will be a loosening of standards in the next survey.
More generally, it is difficult to quantify the impact of these lending programmes in terms of lifting GDP. Over time, we will be able to observe the impact on overall borrowing. However, it is not clear what the counterfactual might have been without intervention. Moreover, even an accurate measure of increased borrowing would only tell so much about the stimulative impact on GDP. Firms are likely to be borrowing for several reasons at present – to fund fixed operating costs including payroll, to finance capital spend and for precautionary purposes. At this stage, we cannot tell how much of current borrowing is for precautionary purposes and may be repaid over the coming months and quarters and how much will be spent, ultimately boosting GDP.
Total stimulus – more to come
We have described an unprecedented package of stimulus measures in the US from the federal government and the Federal Reserve. In our estimates, this combined package should provide a peak boost to the economy of around 6ppt in the short term, with Fed policy easing helping to provide an average stimulus of around 2.5ppt of GDP in 2020 and 2021, excluding the impact of further Fed lending programmes (Exhibit 8).
The crucial judgement is whether this has been enough. One measure of this should be our forecast that Q2 GDP is set to contract by 10%qoq. We suggest that this stimulus should limit GDP contraction this year to 3.8% and we forecast an above-consensus 5.3% rebound next year. Yet even on our relatively bullish assessment the US economy will close 2021 1.7% below the level of GDP it would have achieved with potential growth from end-2019. This suggests the US economy would still exhibit spare capacity – a higher level of unemployment than at the start of 2020 and lower capacity utilisation, something that is likely to leave the Federal Reserve struggling to achieve its 2% inflation target – let alone anything higher.
As such we see this as a likely justification for further policy stimulus in the near term. In recent days President Donald Trump, US Treasury Secretary Mnuchin and Fed Chair Powell have all separately suggested that more fiscal stimulus was likely over the coming weeks in the US.
We have argued that the emergency fiscal stimulus applied to date has been effective in supporting household incomes, providing cash to state and local governments for healthcare provision and providing some relief to small businesses. It will be important – but increasingly difficult – to ensure that future fiscal stimulus packages are as effective. Further fiscal stimulus may have to continue to support these same areas, particularly if a second wave of the virus materialises. However, focus should also shift towards efforts to stimulate future activity. Previous attempts to stimulate corporate investment through tax breaks have met with only limited success and other tools may have to be explored to boost corporate spending – perhaps including conditional corporate debt relief. Moreover, difficulties in boosting corporate spending may require direct government spending – possibly into productivity-enhancing infrastructure.
- Q0JyYXRlcy5jb20=
- VGhpcyBhZGRlZCB0byB0aGUgJDVibiBjb21taXR0ZWQgdG8gcmVkdWNlIHRoZSBvbmUtd2VlayB3YWl0aW5nIHBlcmlvZCBmb3IgdW5lbXBsb3ltZW50IGJlbmVmaXRzIGluY2x1ZGVkIGluIHRoZSBGRkNSQS4=
- RmVkZXJhbCBSZXNlcnZlIEFjdCAxMyAoMyk=
- U2ltdWxhdGlvbnMgZGVyaXZlZCBmcm9tIHRoZSBGZWTigJlzIFVTIGVjb25vbXkgbWFjcm9tb2RlbCwgRlJCVVM=
- V2lsbGlhbXMsIEouLCDigJxNb25ldGFyeSBQb2xpY3kgYXQgdGhlIFplcm8gTG93ZXIgQm91bmTigJ0sIEZSQiBTYW4gRnJhbmNpc2NvLCAyMDE0
- RW5nZW4sIEUuTS4sIExhdWJhY2gsIFQuLCBhbmQgUmVpZnNjaG5laWRlciwgRC4sIOKAnVRoZSBNYWNyb2Vjb25vbWljIEVmZmVjdHMgb2YgdGhlIEZlZGVyYWwgUmVzZXJ2ZeKAmXMgVW5jb252ZW50aW9uYWwgTW9uZXRhcnkgUG9saWN54oCdLCBGUkIsIDIwMTU=
- SW1wb3J0YW50bHkgdGhlIElHIHJhdGluZyB3YXMgYXMgb2YgMjIgTWFyY2ggMjAyMCwgYmVmb3JlIG1hbnkgSUcgYm9uZHMgd2VyZSBkb3duZ3JhZGVkIHRvIGhpZ2ggeWllbGQgb3Ig4oCcanVua+KAnSBzdGF0dXMsIG1lYW5pbmcgdGhlIEZlZCBjYW4gc3RpbGwgYnV5IG1hbnkg4oCcZmFsbGVuIGFuZ2Vs4oCdIGJvbmRzLg==
Not for Retail distribution
This document is intended exclusively for Professional, Institutional, Qualified or Wholesale Clients / Investors only, as defined by applicable local laws and regulation. Circulation must be restricted accordingly.
This document is for informational purposes only and does not constitute investment research or financial analysis relating to transactions in financial instruments as per MIF Directive (2014/65/EU), nor does it constitute on the part of AXA Investment Managers or its affiliated companies an offer to buy or sell any investments, products or services, and should not be considered as solicitation or investment, legal or tax advice, a recommendation for an investment strategy or a personalized recommendation to buy or sell securities.
It has been established on the basis of data, projections, forecasts, anticipations and hypothesis which are subjective. Its analysis and conclusions are the expression of an opinion, based on available data at a specific date.
All information in this document is established on data made public by official providers of economic and market statistics. AXA Investment Managers disclaims any and all liability relating to a decision based on or for reliance on this document. All exhibits included in this document, unless stated otherwise, are as of the publication date of this document. Furthermore, due to the subjective nature of these opinions and analysis, these data, projections, forecasts, anticipations, hypothesis, etc. are not necessary used or followed by AXA IM’s portfolio management teams or its affiliates, who may act based on their own opinions. Any reproduction of this information, in whole or in part is, unless otherwise authorised by AXA IM, prohibited.
Issued in the UK by AXA Investment Managers UK Limited, which is authorised and regulated by the Financial Conduct Authority in the UK. Registered in England and Wales, No: 01431068. Registered Office: 22 Bishopsgate, London, EC2N 4BQ. In other jurisdictions, this document is issued by AXA Investment Managers SA’s affiliates in those countries.