
Bear market playbook
- 20 April 2020 (10 min read)
Key points
- The uniqueness of different bear market triggers leaves little convincing evidence of recurring patterns to aid market timing. We see limited merit in attempting to ‘bottom fish’ and advocate a prudent approach to risk management.
- We expect activity to pick up moving into the second half of the year, implying that the ongoing equity slump is likely to be at the shorter end of drawdowns observed in recent history.
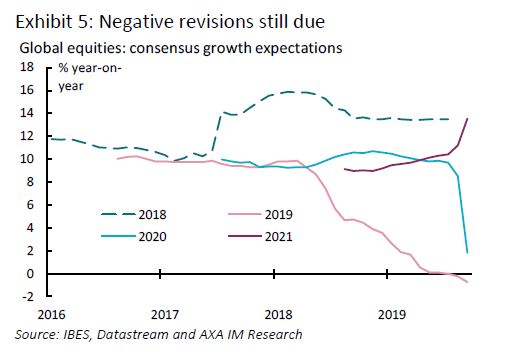
- Investors are trying to actively price in the highly uncertain growth trajectory, the impact of the robust stimulus packages and the recovery prospects in the second half of the year. Consensus earnings expectations still appear stale despite the large negative revisions.
- Markets have historically troughed around two quarters before the nadir in earnings. The way the growth shock versus stimulus backstop plays out remains key, as the transition from a bear market rebound to the start of a bull market rests on the visibility of coming earnings growth.
Bear lockdown
The rapid spread of coronavirus across the world has created a sharp drop in demand in the global economy, pushing stocks into a bear market after one of the longest bull markets in recent financial history. The rally had lasted around 130 months – more than 10 years – and delivered an annualised total return for global equities of a little over 11% in US dollar terms (Exhibit 5). At the time of writing, the total drawdown for global equities has been around 18% – the peak to trough drawdown for global equities before the recent rebound was 34% – driven by a rapid deterioration in the earnings outlook and recessionary fears.
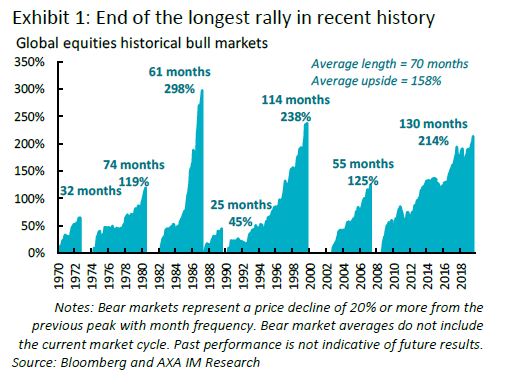
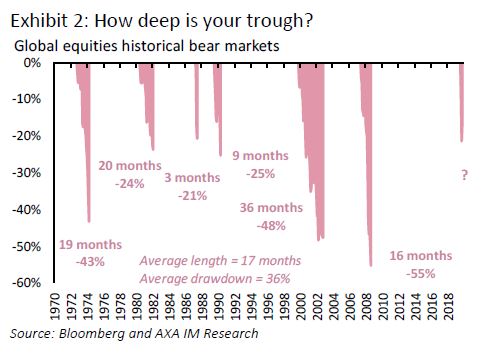
To put the crash in perspective, we looked at the six bear markets that have taken place since the 1970s. These had an average drawdown of close to 36% and typically lasted around 17 months. Looking beyond averages is advisable, as the ranges in terms of drawdowns lie between -21% and ‑55%. There also tends to be a meaningful variation in the lengths of bear markets, lasting anywhere between three months and three years (Exhibit 5).
Examining previous episodes of equity performance leaves us with little concrete evidence of strong recurring patterns. Given the uniqueness of each bear market trigger – especially in the current context – we see limited merit in attempting to ‘bottom fish’ and advocate investors keep a prudent approach to risk management. We expect activity to pick up moving into the second half of the year, implying that the ongoing equity slump is likely to be at the shorter end in terms of drawdown length.
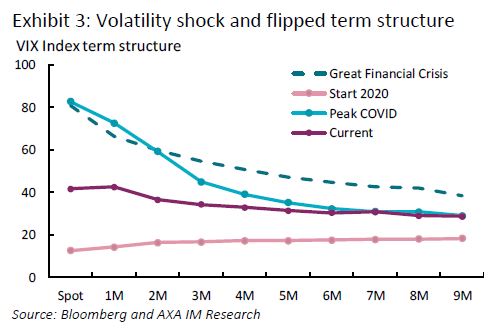
Equity markets suffered a severe volatility spike with the VIX – the popular fear gauge – surging to over 80 points from a trading range of 12 to 20 points earlier this year. Those levels were last seen during the 2008 global financial crisis. Volatility levels and the term structure of the futures curve have started to normalise after the massive spike (Exhibit 5). 2020 is likely to be a clear regime shift in equity market volatility, as we potentially move out of the coronavirus scare and straight into election mode in the United States.
Earnings recession in the making
The US earnings season has kicked off on a negative note, with financial companies missing expectations to the tune of 38% so far, largely attributable to a ramp up in loan loss reserves. Over the course of the earnings season, management guidance on growth is likely to be cautious, with limited information on short-term growth numbers given the uncertainty. The focus is likely to be on cash position and the impacts of the lockdown. Corporate pay-out is expected to be conservative with considerable cuts to buyback programs and dividend disbursements.
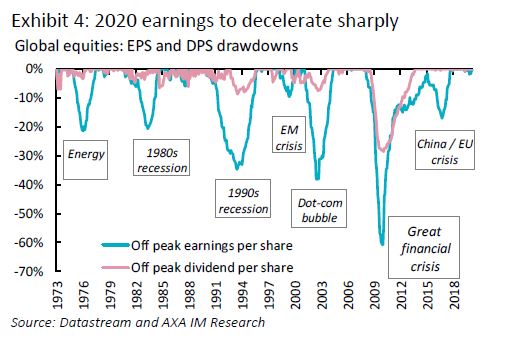
Given recent price action, and looking at historical precedence, an earnings contraction of around 25% appears to be priced in (Exhibit 5). This seems a bit optimistic given the global financial crisis (GFC) precedent but reflects how the market is trying to actively price in the highly uncertain growth trajectory, the impact of the robust stimulus packages put in place globally and the recovery prospects in the second half of the year. Still positive for global equities, consensus earnings expectations at this juncture appear stale despite the large negative revisions. News flow and guidance over the course of the first quarter earnings season will be a key anchor and should underpin the direction of 2020 estimates (Exhibit 5).
Flatten the curve
Timing and quantification of this situation is extremely challenging, but high-frequency information on the evolution of the epidemic is crucial at this juncture – given that the spread of the virus itself remains the biggest wildcard. A sustainable rebound in the asset class is likely to only be triggered when investors have sufficient confidence that the virus is being contained globally. Effective transmission of monetary and fiscal policy would also give the rebound legs.
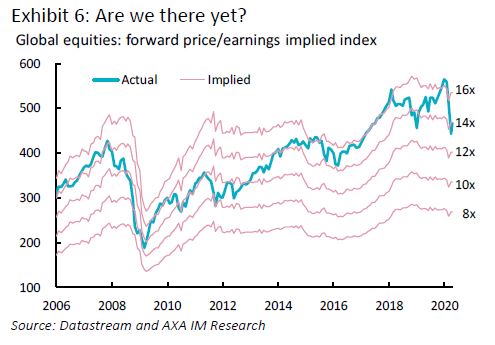
Global equity valuation multiples are now back to around 14 times forward earnings (from closer to 12 times) after the quick bounce back driven by signs of containment measures working and the strong policy response globally. A more severe move down to around 10 times forward earnings, as seen in 2008-2009, would imply a further drawdown of roughly 30% from global equity index prices at the time of writing (Exhibit 6).
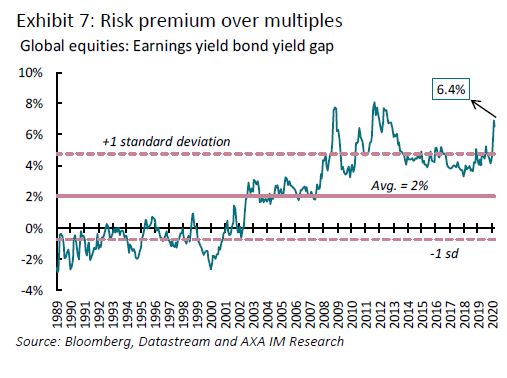
Typically, in crises, markets and multiples have tended to trough roughly two quarters before the trough in earnings per share. The recent price action in equity and bond markets have also pushed the earnings and bond yield gap close to record highs (Exhibit 5). Given the grab for yield is likely to persist, equity risk premia proxies should be better indicators of value for the asset class.
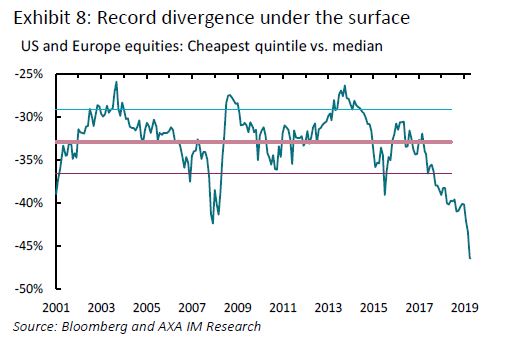
Below the surface, the dispersion in valuation multiples within major indices is at unprecedent levels. The divergence driven by the high bid for growth/quality names is more pronounced after this crash. The median stock in the United States and Europe now trades at a trailing earnings’ multiple of 16.2 times while the lowest quintile is close to 8.7 times, implying a discount of 46%. This surpasses the levels observed in the dot-com era and 2008 financial crisis (Exhibit 8). The gap is mirrored in the earnings growth and financial leverage profiles of the respective buckets, reflecting the current state of business disruption.
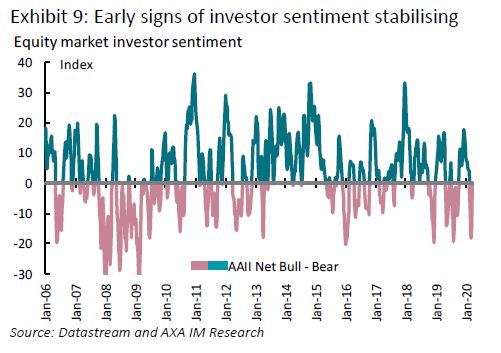
Although standard investor sentiment and positioning indicators appear to be suggesting early signs of capitulation (Exhibit 9), markets have not stabilised, which is evident in the still considerable daily swings. When we will see economic activity normalise is highly dependent on the success of containment measures and the transmission mechanism of the policy stimulus put in place. The way the growth shock versus stimulus backstop plays out remains key, as the transition from a bear market rebound to the start of a new bull market rests on the visibility of coming earnings growth.
Not for Retail distribution
This document is intended exclusively for Professional, Institutional, Qualified or Wholesale Clients / Investors only, as defined by applicable local laws and regulation. Circulation must be restricted accordingly.
This document is for informational purposes only and does not constitute investment research or financial analysis relating to transactions in financial instruments as per MIF Directive (2014/65/EU), nor does it constitute on the part of AXA Investment Managers or its affiliated companies an offer to buy or sell any investments, products or services, and should not be considered as solicitation or investment, legal or tax advice, a recommendation for an investment strategy or a personalized recommendation to buy or sell securities.
It has been established on the basis of data, projections, forecasts, anticipations and hypothesis which are subjective. Its analysis and conclusions are the expression of an opinion, based on available data at a specific date.
All information in this document is established on data made public by official providers of economic and market statistics. AXA Investment Managers disclaims any and all liability relating to a decision based on or for reliance on this document. All exhibits included in this document, unless stated otherwise, are as of the publication date of this document. Furthermore, due to the subjective nature of these opinions and analysis, these data, projections, forecasts, anticipations, hypothesis, etc. are not necessary used or followed by AXA IM’s portfolio management teams or its affiliates, who may act based on their own opinions. Any reproduction of this information, in whole or in part is, unless otherwise authorised by AXA IM, prohibited.
Issued in the UK by AXA Investment Managers UK Limited, which is authorised and regulated by the Financial Conduct Authority in the UK. Registered in England and Wales, No: 01431068. Registered Office: 22 Bishopsgate, London, EC2N 4BQ. In other jurisdictions, this document is issued by AXA Investment Managers SA’s affiliates in those countries.