
Machine learning and factor investing, part II
- 16 April 2021 (5 min read)
Key points
- Moats are enduring competitive advantages that allow firms to achieve sustainable long-term value creation.
- These advantages are rare, but have historically been associated with excess returns.
- Machine learning techniques can help to identify companies most likely to possess these characteristics.
For centuries, societies built moats to defend their most valuable assets. The features of these defenses depended on what they were designed to protect and evolved through time in line with improvements in technology and the changing nature of the threats that communities faced.
One famous example, the Benin Walls in present-day Nigeria, are said to have taken several centuries, and 150 million hours of labour, to construct and extended four times the length of the Great Wall of China. The moat that surrounds Angkor Wat in Cambodia, the world’s largest Buddhist temple, is so big that you can see it from Outer Space.
Moats in investing
Unfortunately, the moats that investors care most about are considerably more difficult to detect.
In a world in which growth is famously fleeting and profitability commonly reverts to the mean, enduring competitive advantages that protect a company’s earnings from its rivals are rare. However, the reward for identifying the exceptions is clear: Firms that have delivered sustained growth in fundamentals relative to their peers have typically provided excellent returns. These returns explain the energy that investors have spent on moats, ever since Warren Buffett revealed that they were at the heart of his investment approach, saying in his 1995 letter to shareholders: “In business, I look for economic castles protected by unbreachable moats”.
As noted in the first part of our series on Machine learning and factor investing, recent advances in computing power and data availability have provided investors with a new and powerful set of tools with which to tackle old challenges. Identifying moats is one area where Rosenberg Equities believes machine learning can add value on top of a traditional investment process.
All of Rosenberg Equities’ investment strategies target high quality companies. In our risk-reduction portfolios, we pair our proprietary view of quality with the low volatility factor because we believe that companies with more sustainable earnings are likely to be less volatile in the future. In higher risk strategies, we incorporate quality alongside value and investor sentiment with the aim of ensuring that undervalued companies aren’t “cheap for a reason” and that positive momentum is backed up by robust fundamentals.
Our efforts to identify moats are built on this foundation. Our moat model aims to uncover companies that will grow revenues faster than their peers, while maintaining or expanding their edge in terms of operating margins. The inputs to the model are fundamental, encompassing a range of variables designed to capture the efficiency and flexibility of a company’s operations, its performance relative to peers, and management’s confidence and commitment to innovation. Firms with the right combination of these attributes, we believe, are more likely to achieve defensible growth.
Identifying moats
In the first part of our series, we introduced our “regret aversion” model, powered by a neural network. In the case of our moat model, the technique used to generate insights from the data is an alternative approach within machine learning called a random forest. As the name suggests, random forest algorithms are made up of a large number of individual decision trees. Decision trees aim to make predictions by asking a series of true/false questions, whose answers build a picture of the probability that a particular outcome will occur. Think of a game of “20 Questions”, on an industrial scale.
Our model aims to predict the existence of a moat (above-peer-group growth in sales and operating margins) for every company in our investment universe. To do this, we must first train it to identify the kinds of companies that have historically had a moat. In this training process, we supply the model with the fundamental data we have gathered for each company over a specific period of time and the information we want it to learn – the companies that did, and didn’t, meet our definition of a moat. The model identifies relationships between the two that it will use to make predictions when the training period is over (when we are no longer giving it the answers!).
In this subsequent period, we continue to update the model with new information, allowing it to evolve with the market. This “expanding window” approach enables the drivers of the model’s predictions to adjust over time, meaning the relative importance of, say, cumulative spending on research and development, margins and leverage may differ from year to year, based on shifts in their predictive power.
Describing moats
In most applications of machine learning there is a tension between analytical power and interpretability. However, although these models operate beyond humans’ cognitive abilities, they need not exist outside of them. The random forest approach can perform many more calculations, on a much wider range of variables, than a human researcher or traditional quantitative model, but by analysing the model’s outputs we can gain a good understanding of its workings.
For example, the model finds relatively few examples of firms that it deems likely to have a moat – typically only one in five stocks in our investment universe at any given time. This matches our intuition that moats are rare, and therefore potentially valuable, commodities in the equity market.
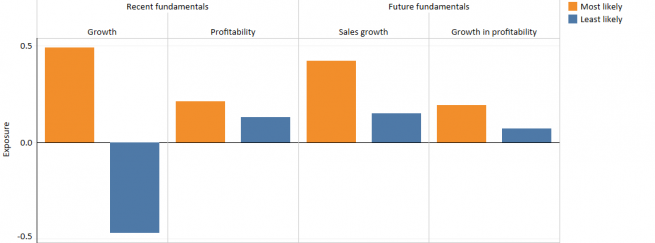
The characteristics of these companies are also in line with our expectations – they score highly on traditional, backward-looking, measures of quality and growth and have delivered consistently strong future growth in sales, profitability and operating margins.
The model’s conclusions also fit with our intuition that moats are more likely to exist in certain parts of the market than others. In the US, for example, technology companies have been most prominent among the model’s predictions in recent years, while in Europe, healthcare companies have featured particularly strongly. Understandably, the model finds very few moats in the heavily regulated utilities sector.
Implementing the moat model
Of course, investment return is the metric that has done most to pique investors’ interest in moats over time. On this front, also, our research confirms our prior belief that companies with a high moat probability have been richly rewarded in the market.
This and other attractive characteristics create scope for us to enhance our investment process by implementing the model as a complement to our existing stock selection signals.
Our examples of historical moats can be instructive here. Beyond its defensive purpose, the design of the moat around Angkor Wat has also played an important architectural role. By keeping groundwater at a steady level, it has stabilised the temple’s foundation, helping to ensure the longevity of the site, which remains the world’s largest religious monument many centuries after its construction. By contrast, large parts of the Benin Walls have vanished. Having endured for almost 500 years, advances in technology conspired to weaken their defenses, leading to their breach in the late 19th century. This may serve as a cautionary tale for moat-seeking investment managers, who must ensure that their processes evolve in time and in line with changing markets. In our view, machine learning offers a number of ways to achieve this goal.
Disclaimer
This document is for informational purposes only and does not constitute investment research or financial analysis relating to transactions in financial instruments as per MIF Directive (2014/65/EU), nor does it constitute on the part of AXA Investment Managers or its affiliated companies an offer to buy or sell any investments, products or services, and should not be considered as solicitation or investment, legal or tax advice, a recommendation for an investment strategy or a personalized recommendation to buy or sell securities.
Due to its simplification, this document is partial and opinions, estimates and forecasts herein are subjective and subject to change without notice. There is no guarantee forecasts made will come to pass. Data, figures, declarations, analysis, predictions and other information in this document is provided based on our state of knowledge at the time of creation of this document. Whilst every care is taken, no representation or warranty (including liability towards third parties), express or implied, is made as to the accuracy, reliability or completeness of the information contained herein. Reliance upon information in this material is at the sole discretion of the recipient. This material does not contain sufficient information to support an investment decision.
Issued in the UK by AXA Investment Managers UK Limited, which is authorised and regulated by the Financial Conduct Authority in the UK. Registered in England and Wales, No: 01431068. Registered Office: 22 Bishopsgate, London, EC2N 4BQ.
In other jurisdictions, this document is issued by AXA Investment Managers SA’s affiliates in those countries.
© 2021 AXA Investment Managers. All rights reserved