
Machine learning and factor investing
- 23 November 2020 (5 min read)
Key points
- Machine learning has the power to uncover previously inaccessible investment insights
- These insights can be of particular benefit to factor investors, where sophisticated data integration and analysis is already a key element of the investment process
- Neural networks help us to ensure our portfolios continue to learn from dynamic and evolving markets
“Make the most of your regrets…” Henry David Thoreau
‘No regrets’ is a great philosophy for life that sadly has little application to investing. Even successful factor investors – systematically investing in strategies with proven long-term track records – can look back on market-beating returns and still find several stocks that failed to meet their expectations over part, or even all, of their holding period.
Fortunately, while investors have no choice whether to face regrets, they can decide what to do with them. In our more than 30 years of experience, Rosenberg Equities has learned a great deal about the elements that influence a stock’s ability to live up to its factor profile. Our active approach is designed to feed these lessons back into our investment process. Intelligent diversification, multi-factor investing, and contextual modelling are core aspects of our process that have evolved out of this research; in recent years, advances in machine learning have added another important item to our toolkit, helping us to ensure our portfolios continue to incorporate insights from constantly evolving markets.
Machine learning in factor portfolios
Machine learning is a form of artificial intelligence in which computer models learn from past data to make predictions with minimal human intervention. Given the dramatic increase in computing power and data availability in the past decade, this type of analysis is being applied to an ever-wider range of problems, including in the world of finance. For us, one of its most exciting contributions is as a complement to our existing factor models, aimed at unearthing the complex interactions between the fundamental drivers of equity market risk and return.
Machine learning’s ability to uncover non-linear relationships between variables is particularly valuable. Traditional factor strategies assume linearity: Lower price-to-earnings multiples, higher historical returns on equity and stronger recent price momentum all translate into higher expected returns – in a straight line. While these and other simple factor insights work on average – and are rewarded more reliably over long than short time horizons – their simplicity inevitably creates blind spots.
Common sense tells us that the world is not always quite so straightforward and that a more nuanced assessment can potentially help to construct better factors. Machine learning provides new, and powerful, ways to implement this intuition in portfolios.
Machine learning and time travel: Bringing regrets forward1
Our factor strategies are designed to achieve a wide range of investor objectives. In risk reduction strategies, we emphasize the low volatility and quality factors, while in portfolios designed to generate higher returns, we blend quality, momentum and value to identify companies with robust fundamentals that are priced too cheaply.
Both sets of combinations have consistently achieved their risk and return objectives in live portfolios. They have also delivered the fundamental outcomes that we believe account for their long-term success: Higher and less volatile earnings growth and yields than the market.2
Of course, these well diversified strategies also have something else in common: Companies that, for whatever reason, don’t deliver the outcomes we expect! Machine learning enables us to analyse these surprises in more detail than before, to study their characteristics through time, and to use this information to identify stocks that may appear attractive to our models today but are at particular risk of disappointment. Instead of suffering the pangs of regret after the fact, we seek to bring them forward to before our investment decision, with the goal of improving stock selection.
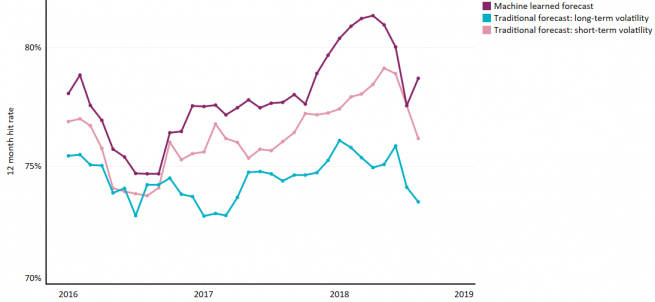
To do this, we use a supervised artificial neural network that we have trained to recognise companies at risk of short-term distress. The model learns to identify these firms by identifying patterns among the stocks in a historical dataset that went on to suffer higher-than-average year-ahead volatility. These companies are clearly unsuitable candidates for a low-risk portfolio and are typically unnecessary, or even unhelpful, additions to return-seeking strategies. Indeed, long-term analysis suggests that reducing the weight of these stocks in our portfolios can potentially meaningfully improve the performance of both low volatility and value-oriented strategies. In our tests, machine learning techniques have proven to be more effective at identifying these stocks than traditional linear methods based on historical risk (as shown in Exhibit 1, below).
- U2VlIEFubmllIER1a2UsIOKAnFRoaW5raW5nIGluIEJldHM6IE1ha2luZyBTbWFydGVyIERlY2lzaW9ucyBXaGVuIFlvdSBEb27igJl0IEhhdmUgQWxsIHRoZSBGYWN0c+KAnSwgMjAxOA==
- IFBhc3QgcGVyZm9ybWFuY2UgaXMgbm8gZ3VpZGUgdG8gZnV0dXJlIHBlcmZvcm1hbmNlLg==
How does the model work?
Neural networks are made up of interconnected sets of inputs (nodes) that can be trained to model relationships in a similar way that certain biological systems, such as the brain, process information.
Data scientists have discretion over both the number and nature of the inputs they use in their neural networks. In our model, we emphasise parsimoniousness and economic intuition, using about a dozen variables with which we have extensive research experience and which we believe can provide clues about a company’s underlying performance. These include measures of quality, valuation and volatility, such as models of potential asset impairment, default risk and dividend cut, price to book and earnings ratios, and short-term share turnover, as well as price momentum and fluctuations.
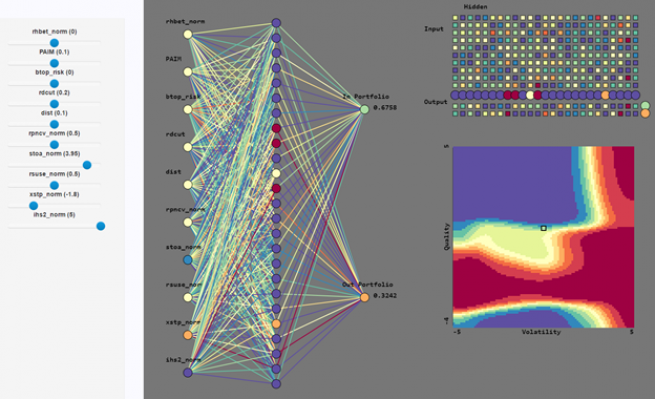
In simple terms, the model assesses each input variable’s effect on future volatility, then evaluates this with reference to all of the other attributes to construct a multi-dimensional perspective that accounts for the interactions between variables. The graphic above gives a sense of the model’s general structure and output. The “input layer” on the left contains the predictor variable values. These values are passed to the second column – called a hidden layer – with varying weights depending on the predictive power of each (represented by the colours of the connecting lines). Each node in the hidden layer is a separate logistic regression with its own blend of weights on the input variables. Calculations from the hidden layer are then blended with various weights to generate the output layer (the final column), which contains the probability that a stock will become high or low risk.
The non-linear output of the model is shown on the right-hand side of the chart. Distinct from the simple factor insights mentioned above (which would show diagonal bands of colour in the grid), our model reveals a more complex topography of potential regrets. Stocks that the model locates in these areas can either be excluded or down weighted in our investment process.
Overcoming regret aversion
Behavioural economics tells us that investors typically do a bad job of dealing with regret. When not carefully managed, their “regret aversion” can lead to indecision or to unhelpful deviation from sensible long-term investment strategies.
Factor investing may be particularly susceptible to this. While decades of data support the long-term effectiveness of these strategies, at some point all experience periods of underperformance. What’s more, even outperforming portfolios will inevitably hold stocks that trail the market, or fail to hold those that strongly beat it, over time. The recent high-profile outperformance of certain stocks with weak factor footprints has demonstrated this point clearly.
We have strong conviction in the insights that drive our factor strategies. Nonetheless, we believe that studying the stocks that fail to live up to our expectations and systematically incorporating this information into our investment process offers an important opportunity to improve their long-term performance. Machine learning techniques can make particularly compelling contributions in this area, adding considerable analytical power as well as opening up previously illusive non-linearities. While these techniques won’t remove regrets from our portfolios, we believe that they will play a key role in helping us to make the most of them.
Not for Retail distribution
This document is intended exclusively for Professional, Institutional, Qualified or Wholesale Clients / Investors only, as defined by applicable local laws and regulation. Circulation must be restricted accordingly.
This document is for informational purposes only and does not constitute investment research or financial analysis relating to transactions in financial instruments as per MIF Directive (2014/65/EU), nor does it constitute on the part of AXA Investment Managers or its affiliated companies an offer to buy or sell any investments, products or services, and should not be considered as solicitation or investment, legal or tax advice, a recommendation for an investment strategy or a personalized recommendation to buy or sell securities.
Due to its simplification, this document is partial and opinions, estimates and forecasts herein are subjective and subject to change without notice. There is no guarantee forecasts made will come to pass. Data, figures, declarations, analysis, predictions and other information in this document is provided based on our state of knowledge at the time of creation of this document. Whilst every care is taken, no representation or warranty (including liability towards third parties), express or implied, is made as to the accuracy, reliability or completeness of the information contained herein. Reliance upon information in this material is at the sole discretion of the recipient. This material does not contain sufficient information to support an investment decision.
Issued in the U.K. by AXA Investment Managers UK Limited, which is authorised and regulated by the Financial Conduct Authority in the U.K. Registered in England and Wales, No: 01431068. Registered Office: 7 Newgate Street, London, EC1A 7NX (until 3rd September 2020); 155 Bishopsgate, London, EC2M 3YD (until 31st December 2020); 22 Bishopsgate, London, EC2N 4BQ (from 1st January 2021).
In other jurisdictions, this document is issued by AXA Investment Managers SA’s affiliates in those countries.