
Negative correlation: Why investors should not lose faith in fixed income
- 27 September 2022 (7 min read)
- The first half of 2022 witnessed the worst sell-off across all fixed income assets on record
- Many have questioned the role a diversified fixed income allocation can play in a portfolio
- In our view, balancing interest rate risk with credit spread risk remains key for investors seeking attractive risk-adjusted returns across a market cycle
Investors have endured a seismic negative return shock across global financial markets in the first half of 2022 – with many fixed income asset classes witnessing the worst start to a calendar year on record.
Taking a Global Credit Index, which combines interest rate and credit spread sensitivity, total returns in 2022 recorded a historic decline of 13% at the end of June. The previous low for a first half-year return since the index began in 1996 was a mere -2.2%, which notably occurred in the first half of 2018 during the previous hiking cycle by the Federal Reserve.1
Today, central banks are once again raising interest rates to slow economic growth, but this time in response to rampant inflation which has been higher and more persistent than many could have predicted.
Add to the mix the ongoing Ukraine crisis, the dramatic surge in energy prices, as well as the looming threat of recession; the concoction of ingredients has together conspired to create a highly toxic backdrop for investors.
One of the most damaging sub-plots to the current sell-off has been the breakdown in the negative correlation between interest rate and credit spread movements, leaving global fixed income investors with nowhere to hide.
Traditionally, the impact of pure interest rate movements on fixed income returns has been negatively correlated with the impact of pure credit spread movements on returns. Credit spread is the difference between the yield on corporate bonds and the yield on government bonds – reflecting the additional yield required for investors to hold a ‘riskier’ corporate bond.
However, in our view, the merits of a diversified approach to global fixed income investing remain as pertinent today as ever – even as we undergo a regime shift, following years of low inflation and loose monetary policy to a brave new world, offering up a fresh set of opportunities and challenges.
Unshackled
The years following the 2008/2009 financial crisis have been dominated by low interest rates and the expansion of central bank balance sheets through quantitative easing policies, which in turn have driven fixed income yields to historic lows.
Given that bond yields move inversely to prices, a diversified pool of fixed income has performed very well over this period, albeit with some hiccups along the way. A basket of high-quality sovereigns and credit, represented by a Global Aggregate Index, returned +2.74% per annum from the start of 2009 to the end of 2021. For the more adventurous, the annualised return on a Global High Yield Index was +10.57% per annum over the same period.2
Despite these results, it is worth remembering the primary driver of returns in these cases is very different, as are the potential risks which investors are exposed to. This is due to the relative sensitivity of different fixed income asset classes to the two major risk factors driving fixed income returns: Interest rate risk and credit spread risk (i.e. the excess return gained from investing in corporate bonds).
Government bonds, on the one hand, are driven by the outlook for interest rates and inflation. Duration measures the sensitivity of bond prices to changes in interest rates and is the key risk factor when it comes to the impact that interest rates have on government bond returns. The yield curve – the line which plots the yields of bonds which have equal credit quality but different maturity dates – acts as a forward-looking indicator of interest rate expectations. This means the relative performance of short-dated versus long-dated bonds (i.e. steepening versus flattening) is constantly changing, based on the outlook. The prices of longer-maturity bonds are more sensitive to changes in interest rates therefore are likely to outperform when rates are falling and underperform when rates are rising. Bond investors refer to the difference in performance from short-to-long-maturity bonds in respect of changes in rates as duration risk.
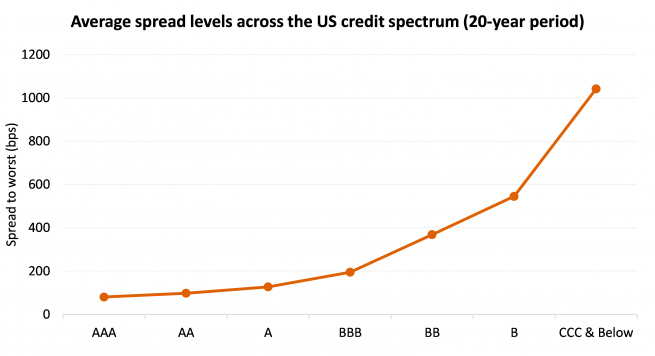
Further down the credit spectrum, the dominant risk factor increasingly shifts towards the issuer’s probability of default, reflected in the level of credit spread. Spreads will increase exponentially down the credit curve to compensate for increased underlying credit risk, meaning the difference in default risk between highly rated A and BBB corporate bonds is not equivalent to that of those rated B and CCC.
- Qmxvb21iZXJnLCBJQ0UgQm9mQSBHbG9iYWwgQ29ycG9yYXRlIEluZGV4LCBhcyBhdCAzMC8wNi8yMDIy
- Qmxvb21iZXJnIEdsb2JhbCBBZ2dyZWdhdGUgVG90YWwgUmV0dXJuIEluZGV4IFVuaGVkZ2VkIFVTRCwgSUNFIEJvZkEgR2xvYmFsIEhpZ2ggWWllbGQgSW5kZXg=
Beta to alpha
The diversity of opportunities across the yield curve and credit curve emphasises the fact that fixed income is not one homogenous asset class. One of the main benefits of a diversified approach is in the ability to capitalise on these opportunities, but also to decrease the correlation of the underlying strategy to pure rates or credit market beta, which would be more prevalent within a passive or benchmark with tracking error approach.
A Global Aggregate Index, for example, represents a broad range of investment grade issuers across developed markets and emerging markets, but the absence of high yield means the index currently exhibits a duration close to seven years, ensuring that investors will be highly exposed to rates volatility.
In our view, a truly diversified fixed income strategy considers not the specific asset classes which investors are exposed to, but rather the underlying risk factors. The result is a strategy more focused on delivering alpha from a diverse range of sources, with a lower correlation to interest rate and credit risks and thus a greater emphasis on delivering attractive risk-adjusted, rather than outright, returns. At the extreme, a very long duration government bond (a 30-year US Treasury for example) would have a return, through the cycle, that was negatively correlated to the excess (credit) return from a basket of sub-investment grade corporate bonds.
Breakdown
The main issue for fixed income investors in 2022 has been that this low correlation between rates and credit has broken down. Comparing the daily total returns of an all-maturities US Treasury Index to those of a US High Yield Index over a 20-year period, the correlation coefficient [SP1] – the measure determining how the movement of two different variables is associated – is -0.10.3
In 2022, however, the equivalent correlation has crept up to 0.24 – the highest for a calendar year in the post-2008 financial crisis era – with duration and credit spreads positively correlated to the downside.
At a more extreme level, comparing those same US Treasury total returns to the excess returns of US High Yield (i.e. stripping out any return contribution from rates), the correlation coefficient is -0.40 in 2022, compared to a 20-year average figure of -0.61.
Market cycles
It is worth emphasising that 2022 is not the first time we have seen this type of dysfunctional market environment. In recent history, the ‘taper tantrum’ of 2013 led to a period of dislocation across fixed income markets as government bond yields rose in response to the Federal Reserve’s signalling that it would reduce the size of its balance sheet, by tapering its quantitative easing policy, which in turn led to wider spreads.
In 2015 we saw a period of volatility for German government bonds lead into an energy and commodity-driven shock, leading to negative returns across rates, credit and emerging markets. In March 2020, as much of the world headed into COVID-19-enforced lockdowns, liquidity was squeezed and for a few days we saw a sharp sell-off in both rates and credit.
Despite the damage inflicted by such periods of dislocation to total returns, it is worth considering a longer timeframe to judge the benefits of a diversified approach, by which we mean a full market cycle.
Over the cycle, the interaction of rates and credit spreads is constantly changing, as represented below (the direction of the arrows refers to expectations for interest rate hikes / cuts and credit spread widening / tightening):
- QVhBIElNLCBCbG9vbWJlcmcsIElDRSBCb2ZBIFVTIFRyZWFzdXJ5IEluZGV4LCBJQ0UgQm9mQSBVUyBIaWdoIFlpZWxkIEluZGV4LCBhcyBhdCAzMS8wOC8yMDIyLg==
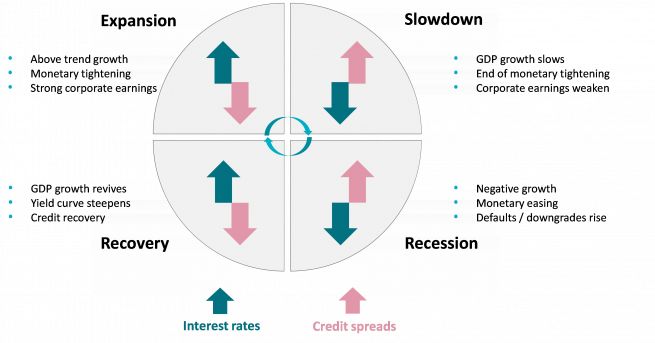
When the cycle shifts from one phase to another, markets can become dislocated. This has been starkly illustrated in 2022; after bouncing back from the economic shock caused by COVID-19, markets are now contemplating a period of tighter financial conditions which should lead to looming slowdown and recessionary phases, eventually with potential rate cuts and further spread widening.
In this environment, investors may want to ensure they are not too exposed to risk assets, which could come under pressure if equity risk premiums rise.
Equity-like
Without sufficient diversification built into a portfolio, bond investors could find themselves exposed to equity-like risk if tilted towards too much credit and high yield, meaning an overall multi-asset allocation which delivers synchronised returns.
To emphasise the point, the correlation of excess returns from US High Yield compared to the S&P 500 over a 20-year period is 0.38 – highlighting the need for investors to be aware of what is under the bonnet of their portfolio.4
More importantly, building a diversified fixed income portfolio over the long term can offer investors different return drivers at different points in the cycle. It might not compete with high yield during an expansionary phase, or indeed government bonds in a recession, but over the full cycle it could potentially deliver a more attractive risk-adjusted return.
Rags to riches
Although we expect the near-term outlook to remain volatile, there is no doubt that medium-term return prospects are now vastly improved across the entire spectrum of global fixed income, with more yield and spread now on offer as a result of the current sell-off.
Yield levels in core government bonds and high yield are at or near 10-year highs, while investment grade credit, which has been hit the most this year by its sensitivity to both rates and spreads, now looks very attractive – with the yield on a Global Credit Index surpassing its COVID-19 peak and at levels not seen since 2009.5
While past performance is no guarantee of future returns, history tells us that this can potentially provide a solid foundation for fixed income return prospects. The chart below shows the previous 10-year peak in yield for select fixed income asset classes before 2022 and the subsequent 12-month total return, together with 2022’s peak for each asset class:
- QVhBIElNLCBCbG9vbWJlcmcsIFMmYW1wO1AgNTAwIFRvdGFsIFJldHVybiBJbmRleCwgSUNFIEJvZkEgVVMgSGlnaCBZaWVsZCBJbmRleCBhcyBhdCAzMS8wOC8yMDIyLg==
- Qmxvb21iZXJnLCBJQ0UgQm9mQSBHbG9iYWwgQ29ycG9yYXRlIEluZGV4IGFzIGF0IDMxLzA4LzIwMjIu
Although history does not always repeat itself, we could be approaching an attractive entry point for potential bond investors. However, to deliver ‘bond-like’ returns, we believe a diversified approach remains vital, to avoid taking on too much unwarranted risk and to provide a potential hedge within a multi-asset portfolio.
Disclaimer
This document is for informational purposes only and does not constitute investment research or financial analysis relating to transactions in financial instruments as per MIF Directive (2014/65/EU), nor does it constitute on the part of AXA Investment Managers or its affiliated companies an offer to buy or sell any investments, products or services, and should not be considered as solicitation or investment, legal or tax advice, a recommendation for an investment strategy or a personalized recommendation to buy or sell securities.
Due to its simplification, this document is partial and opinions, estimates and forecasts herein are subjective and subject to change without notice. There is no guarantee forecasts made will come to pass. Data, figures, declarations, analysis, predictions and other information in this document is provided based on our state of knowledge at the time of creation of this document. Whilst every care is taken, no representation or warranty (including liability towards third parties), express or implied, is made as to the accuracy, reliability or completeness of the information contained herein. Reliance upon information in this material is at the sole discretion of the recipient. This material does not contain sufficient information to support an investment decision.
Issued in the UK by AXA Investment Managers UK Limited, which is authorised and regulated by the Financial Conduct Authority in the UK. Registered in England and Wales, No: 01431068. Registered Office: 22 Bishopsgate, London, EC2N 4BQ.
In other jurisdictions, this document is issued by AXA Investment Managers SA’s affiliates in those countries.
© 2022 AXA Investment Managers. All rights reserved