COVID-19 Update: The drop in activity, the shape of recovery
- 09 April 2020 (10 min read)
Key points
- We have lowered our 2020 global growth outlook to ‑1.8% – the lowest rate on record. Individual country forecasts are similarly reduced: US -3.2%, Eurozone -4.6%, China 2.3% and Japan -5.8%.
- However, we forecast a solid 5.4% global growth rate in 2021 – the fastest since 2010. This would be echoed in individual countries, including the US at 4.0%, Eurozone at 5.2%, China at 8% and Japan at 3.3%.
- Global and most international economies are still likely to see excess supply conditions and a negative output gap persist through the end of 2021, suggesting ongoing disinflationary conditions.
- Our forecasts are predicated on a given assumption for the path of COVID-19. We accept that this path is unknowable and deviation from our assumption would have meaningful effects on the growth outlook.
- As such, we stress the greater reliance on real-time economic data sources to ground our forecasts.
- Future research will consider in more detail additional assumptions on the labour market reaction, policy effectiveness and longer-term ramifications.
As the total number of coronavirus cases approaches 1.5mn and lockdowns extend across many countries, we present our updated thoughts on the virus’s impact on economies worldwide. Over the coming months we will publish a series of notes looking to explain the key aspects of the reaction to the coronavirus, which will determine the shape of overall economic performance. These will include labour market responses, the scale and effectiveness of official policy reaction and the longer-run ramifications of the economic shock, including increased indebtedness. Moreover, these topics are in turn interrelated.
In this paper we outline and explain our latest forecasts. We have reduced our outlook for global growth further to -1.8% – the lowest rate on record dating back to the early 1960s. This forecast involves assumptions on the labour market, policy and broader reactions. As more evidence emerges on these factors over subsequent weeks, we may have to revise our outlook further.
We also explain how our ‘forecasts’ are a function of an underlying assumption of how the coronavirus may develop in the future, and the scale and persistence of lockdown measures in individual economies to halt its spread. However, we suggest that this is fundamentally unknowable. Our forecasts should therefore be considered estimates based on a given future scenario for the virus. We explain that our bottom-up approach is a method that has broadly been followed by the OECD1 and France’s Insee2 institute. We also discuss how we will use real-time indicators to verify our forecasts over the coming quarter.
Conditioning on the unknown
The key difficulty in providing any economic forecast is that we do not know how COVID-19 will develop over the coming weeks, months or quarters. The scientific community is considering many scenarios. Numerous pharmaceutical companies are racing to deliver a vaccine or treatment for coronavirus. While this looks unlikely to impact the virus inside 12-months, it could plausibly provide relief in 2021 and hence impact forward-looking expectations and financial conditions. Alternatively, increased evidence of asymptomatic positive cases in China might further suggest that far more people have contracted COVID-19 without knowing it. This could suggest that “herd immunity” is closer than previously thought. Moreover, large-scale testing might ease the lifting of restrictions over the coming months. Yet more pessimistically, the London School of Hygiene and Tropical Medicine recently published a scenario including recurrent bouts of outbreak over the coming 18 months that would require repeated global lockdowns.
In short, there are many plausible paths the virus could take. But for now, we do not know which is the most likely, nor do we have any means of assessing the probability of any particular one.
Our economic projections are based on an assessment of preliminary evidence from China, the first nation to suffer from a coronavirus outbreak. It introduced a lockdown in Hubei, the province that was the epicentre of the outbreak, on 23 January. Transport restrictions here have only been lifted this week – some 11 weeks after the shutdown began. More broadly, areas of China began to revive before this. Exhibit 1 illustrates Chinese coal consumption – a key proxy activity indicator for China, given coal’s important place in Chinese electricity generation.
Coal consumption suggests that the Chinese economy stayed at lows for approximately 40 days after the Chinese New Year – a total of just over 6 weeks, compared to Hubei’s 11. It has subsequently begun to recover and if it follows this trajectory might see consumption recover pre-New Year levels after around 90 days.
We assume a similar timeline for other economies. Italy introduced a lockdown on 9 March. We assume an 8-week period of lockdown, but from 4 May assume that the economy begins to gradually restart until by July – after a further 8 weeks – it is fully open. We anticipate the same path for other European economies and the US.

As suggested, this is no more than an assumption. It is a slightly more drawn out cycle of activity than China appears to have seen. It is plausible that economies could restart sooner and more quickly. However, as suggested, it is equally plausible that a worse-case scenario could develop. The exact path the virus takes will therefore make the economic impact either deeper or shallower.
To the forecasts – bottoms-up!
Our initial macroeconomic forecasts were a combination of reviewing model predictions and a bottom-up approach. We now revise the latter.
Our bottom-up approach involved looking at specific economic sectors and estimating the degree of impact. For example, with US consumption, we suggested that some sectors would be completely shut, including many restaurants and leisure facilities. We considered some areas, including housing and durable goods that could see marked slowdowns consistent with previous severe downturns. However, other areas, such as healthcare and personal care could see a rise in expenditure. We conducted an analogous exercise across Europe based on a breakdown of gross value added (GVA) output sectors.
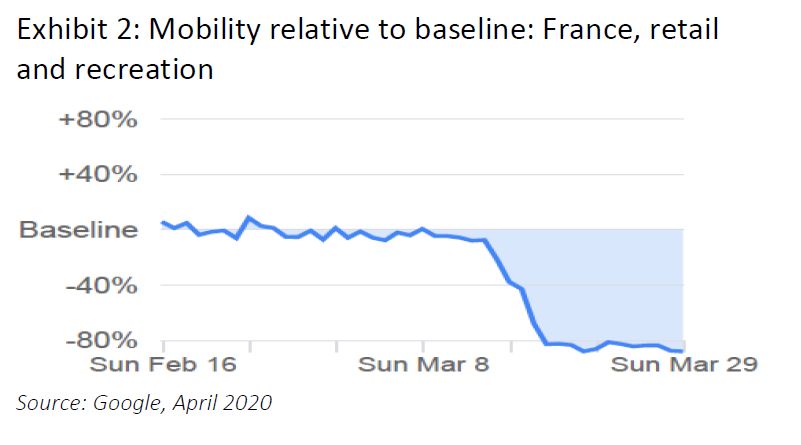
We are aware that these are significant and broad-brushed sectoral assumptions. However, tentative alternative evidence has started to provide some corroborating evidence. Exhibit 2 illustrates reduced mobility (footfall) in French retail and recreation sectors. This is recorded to be 88% lower than the baseline and suggests sub-sectors with an effective 100% fall in footfall. Footfall in French supermarkets and pharmacies, by comparison is down by a smaller 72% from the baseline. However, in New York State, with a total number of cases exceeding those in France, supermarket and pharmacy footfall is only 32% lower.
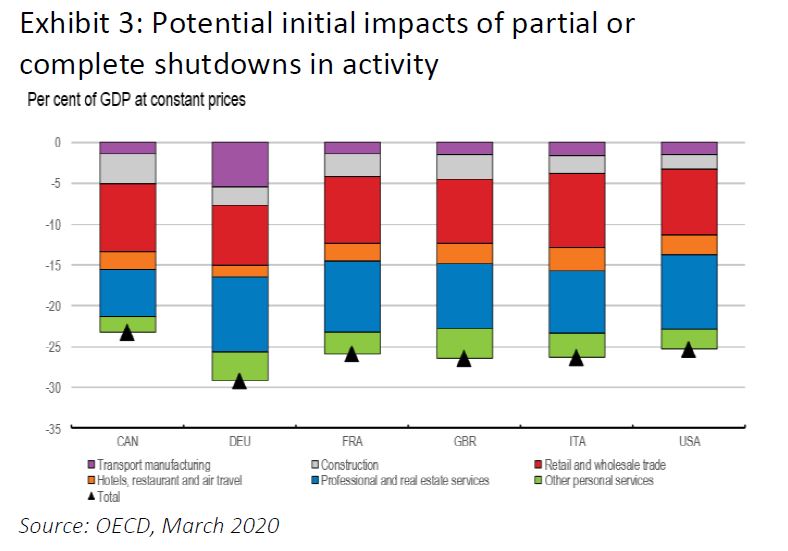
We combined bottom-up estimates of consumption and output for key US and European economies to make our forecasts. Recently French national statistics agency, Insee, posted a similar analysis including data from credit card expenditure3 , broadly consistent with our outlook for the Eurozone. Meanwhile, the OECD produced a similar analysis by country suggesting a 25% annualised impact4 on the US economy (Exhibit 3). Again, this is comparable to our own more pessimistic estimated annualised loss of 31% in the US. We note though that the similarity of these outcomes may only reflect the similarity of approach. All three assessments could still be wildly off.
More fundamentally, this approach is still highly dependent upon the underlying assumption of how long any shutdown and subsequent recovery takes. Hence, we circle back to our assumption that the virus sees an 8-week shutdown and an 8-week recovery. This is equivalent to a 12-week total shutdown period and suggests a total economic shock of 6.5 percentage points (ppt) to the US.
Real-time economic indicators
Given the significant uncertainty inherent in the forecasts and the lack of modern-day historic precedent to anchor our forecasts, it is even more important to verify this outlook with economic data. Official second quarter (Q2) GDP reports – likely to be the most adversely effected quarter for most developed economies – will not be available before late July. As such, we will look to other indicators to ground our projections in a timelier manner.
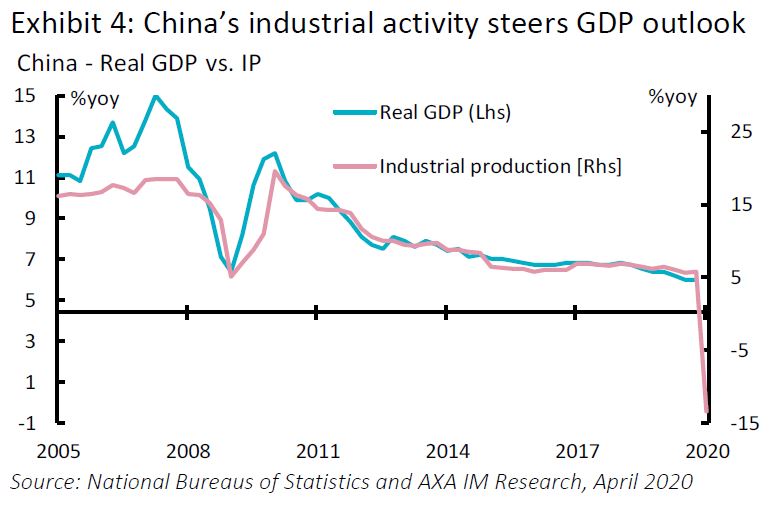
This process is already underway, particularly in China and to a lesser extent in Europe, both of which endured the most severe initial outbreaks. Exhibit 4 illustrates the impact of China’s shutdown on industrial activity – a key guide to GDP over recent decades. The drop in industrial activity has thus been part of our expectation of a sharp drop in China GDP in Q1.
Similarly, early estimates of European Purchasing Managers Indices (PMIs) have helped to ground our European forecasts. March’s manufacturing PMI dropped to 44.5 – its lowest level since July 2010, while the services PMI reached an all-time low of 26.4. Exhibit 5 illustrates that this is consistent with a steep fall in activity, consistent with our outlook for an 8.4% drop in Q2.
However, both data sets are still suffering a time lag, with even the PMIs – amongst the first of the monthly economic releases – still not fully available for April until the start of May. As such, we consider more timely data.
The US has a series of weekly (and higher frequency) data, including Red Book sales5 , weekly jobless claims, consumer confidence and mortgage applications. These provide a timelier update of US activity, including US jobless claims recording a 10mn increase in the last two weeks – compared to March’s official payrolls release which recorded a 701k drop in employment.
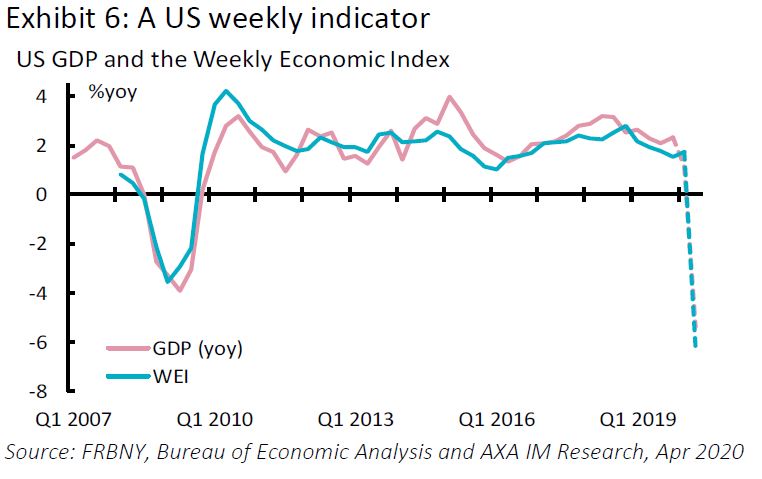
The New York Federal Reserve (FRBNY) has combined a range of weekly indicators to create an index that has closely tracked overall activity since 2008 (Exhibit 6)6 . The final observation in the chart is the last reading (for 28 March) extended throughout Q2. This is currently consistent with our forecast for a 19% (annualised) drop in US economic activity in Q2, albeit that we assume some improvement in activity later in the three-month period. Over the coming weeks, this will help gauge the scale of drop in US Q2 activity.
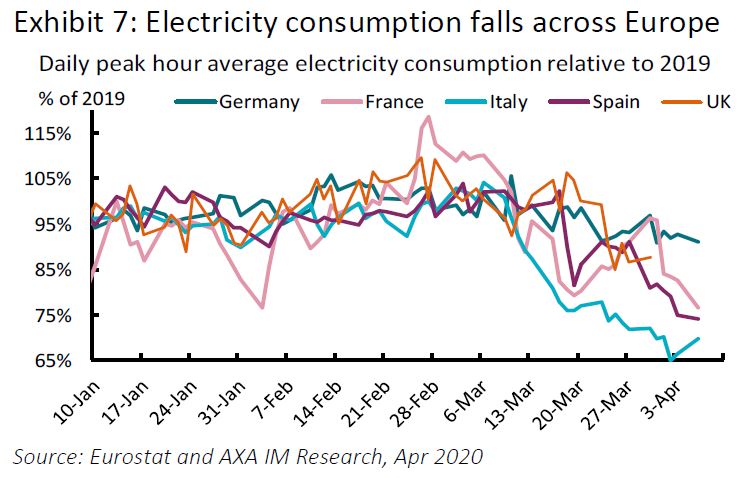
There are fewer high-frequency indicators for Europe. However, we track electricity output. Exhibit 7 shows output across a range of European economies, illustrating how output has declined sharply across all countries in recent weeks, but confirming the expected phasing, with Italian output beginning to fall first from 9 March when Italy introduced its lockdowns. These figures corroborate the timing of the weakening in economic activity, but as with China’s coal consumption, we expect them to be a good indicator of the timing of a future recovery.
As well as being a guide to the timing of changes in underlying trends in activity, this data can also act as a guide to the scale of slowdown. Exhibit 8 illustrates annual electricity demand and GDP growth at the Eurozone level. There remains a lot of noise around the electricity data, however, it clearly identifies the significant loss of output around the time of the financial crisis. While we may not be able to fine tune our GDP forecasts based on these figures, they are likely to be a good indicator of the order of magnitude of the decline.

After the fall – prospects for a H2 2020 rebound
Even when we have a clear view of the scale of the drop in economic activity over the coming quarter, the overall assessment of economic GDP will depend on the subsequent rebound. Future research will focus in more detail on the labour market reaction, policy response and the growth impact of longer-term ramifications, particularly the large increase in government and corporate indebtedness. Below we briefly discuss our current assumptions for these issues. For now, we expect to see growth return in the second half (H2) of the year, with most countries posting strong quarterly growth in Q3 and all economies expected to rise strongly in Q4 2020. In the coming weeks, additional evidence may lead to a more fundamental re-evaluation of these assumptions, which could in turn adjust the growth outlook.
Labour market reaction is likely to be critical. At present there is a very contrasting picture emerging from different countries. In the US, the official unemployment rate has risen to 4.4%, but jobless claims rose by 10mn in the last two weeks of March alone. In the UK, Universal Credit claims were reported to have increased by 950k in the last two weeks of March, but recent data suggest around 9mn furloughed workers. By contrast, in Germany unemployment was reported to have risen by just 1k in March. However, here the Kurzarbeit, short-time work scheme, has recorded use by 470k firms in Germany in March, compared to a total of 100k over the entire 2008-09 recession. This suggests a widely different labour market reaction. However, we believe that labour market attachment will prove critical – that is, how attached workers remain with companies. This is directly observable in Germany, but even in the US, many that now claim unemployment benefits remain on the books of some large employers. This should facilitate a swift return to work once activity resumes, avoiding the search and frictional costs usually associated with reducing unemployment. Moreover, most governments are providing significant income support to temporarily laid-off workers. Short-time work schemes across Europe see on average 84% of worker wages covered by the governments, this has been mimicked in the UK with schemes launched to support employed and self-employed incomes at up to 80% of previous earnings. In the US a supplement in the recent stimulus package means that for most states, unemployment claims will exceed the median income of workers. Such income support should minimise the hangover of the Q2 activity drop on future quarters’ consumption.
Policy reaction is also critical. The scale and breadth of policy support worldwide has been unprecedented, quicker and more far-reaching than even during the financial crisis. Policy measures have included monetary, macroprudential and fiscal policy easings. Most countries have seen direct government fiscal stimulus from 2-7% of GDP, many with contingent loan guarantee schemes on top of that. The overall aim of these stimuli have been to facilitate the transfer of the cost of the immediate collapse in activity either to private or public sector balance sheets. The former has been encouraged by central banks lowering borrowing rates, reducing capital requirements and facilitating commercial banks’ lending, and has been supplemented by government loan guarantees. The latter has been carried out by direct grants, individual pay-outs and social security increases. At present, we estimate a combined stimulus of around 8% of GDP in the UK, and larger in the US. This could rise further, particularly if future stimulus focuses on creating replacement demand to make up for that over the coming months. The scale of policy stimulus should minimise the short-term economic impact of coronavirus and pave the way for a rebound in activity over the coming quarters.
Yet there will be many longer-term ramifications of this COVID outbreak. Increased indebtedness is currently uppermost on our minds. Governments across the globe endured a material increase in indebtedness during the financial crisis. Recent efforts will raise this further, in many cases taking overall debt back to levels not seen since World War II. With the past decade a warning of the economic and social consequences of prolonged austerity, a key challenge for future growth will be how governments address this. But many corporates entered this downturn with elevated levels of debt, and these will also be increased. Corporate indebtedness will at the very least weigh on future investment and hiring decisions and is likely to constrain any future rebound, despite stimulus measures. Moreover, with the uncertainty about the future path of coronavirus likely to remain high, this may also weigh on investment spending. Moreover, behavioural changes associated with the virus could result in longer-term changes to business operation and efficiency. In all, there are likely to be persistent headwinds to the outlook for recovery from the initial economic impact.
Finally, financial conditions and the behaviour of financial markets over the coming quarters will both affect and be affected by the shape of the recovery. Financial markets have already seen a steep adjustment following the outbreak of the coronavirus. Markets may prove braced for bad news over the coming weeks, even as the depth of economic contraction is revealed. Indeed, there was little reaction to the Banque de France’s announcement that French Q1 GDP could see a 6%qoq contraction. However, markets are likely to be sensitive to the scale and timing of recovery, with US equity markets recovering recently as the White House discusses plans for re-opening the economy – albeit for some point in the future. For markets, clearer signs that economies might begin to rebound in H2, albeit after an horrific H1, will likely underpin some stability and recovery in financial markets, which in turn would provide a tailwind for the economic recovery. However, should such a rebound prove elusive, slower growth is likely to be exacerbated by a further tightening in financial conditions. Once again, this underlines the importance of the above factors, but more fundamentally the still unknown future path of the virus.
Economic forecasts
Appendix 1 presents our fully-revised global growth forecasts. Exhibit 9 provides an overview. We have lowered our global growth forecast to -1.8%, on an International Monetary Fund (IMF) purchasing power parity weighted approach. This is equivalent to around -2.3% on a World Bank dollar-equivalent based weight. This would be the sharpest annual fall recorded since the 1980s for the IMF and 1961 for the World Bank, falling below the previous lows at the time of the financial crisis (2009 at -0.1% and -1.7% respectively).
This forecast also includes an assessment that growth is likely to return in H2, and in many countries, including China and across Europe, in Q3. Although this rebound is unlikely to see the level of GDP return to pre-Covid levels, it should secure the foundation for a strong revival in annual growth across 2021, at least subject to the assumptions outlined above.
Specific country estimates tend to repeat this overall analysis. We forecast US GDP at -3.2% for 2020, marking the deepest contraction on record (back to 1950) despite an expectation for a strong quarterly expansion in Q4 2020. Eurozone growth is forecast to fall by -4.6% for 2020 – its own sharpest contraction on record, with the COVID shock coming on top of an economy already close to stall speed, but growth rebounding strongly from Q3. For Japan, the economy had already posted a deep 7.1% annualised contraction in Q4 2019 after an increase in consumption tax and the impact of Typhoon Hagibis. With a Q1 rebound being hindered and rising cases seeing a State of Emergency announced in Q2, we now forecast Japanese GDP growth to fall by 5.8% in 2020. We also estimate Chinese GDP growth to slow to 2.3% – again the weakest annual growth rate for China in records back to the early 1990s.
We also expect a large acceleration in growth for 2021, forecasting global growth rising by 5.4%, with US growth rising by 4.0% (a 17-year high), Eurozone by 5.2%, China by 8% and Japan by 3.3%. This assumes no recurrence of COVID beyond 2020, protection of the labour market and the full impact of current and future policy initiatives. As discussed, this includes an assumption of headwinds from indebtedness, uncertainty and other factors.
There will of course be differences and commonalities in our individual country GDP outlooks and our longer-term growth assumptions. With the usual discussion about the shape of a recovery, our own outlook defies the standard classifications (V, U, W or L-shaped). At this stage, we argue that our outlook is likely to fall between a U and L-shaped pick-up, something resembling the Nike “swoosh”. The forecast shape of our recovery has related implications. We do not expect the global economy to recover its previous trajectory in 2021, despite the faster growth in that year. As such, we expect international economies to continue to exhibit conditions of excess supply. This output gap across 2020 and 2021 is likely to see disinflation over the coming years.
Indeed, the combination of weak demand and a steep fall in oil prices suggests a much weaker inflation picture than before. In the US, where disinflationary trends are compounded at present by the rise in the dollar, we forecast inflation slowing to average -0.8% in 2020 – its lowest annual average in records back to the 1950s. In the Eurozone, there will also be a risk of inflation falling below zero, while in the UK we forecast inflation to fall to 0.5% in 2020 from 1.8% in 2019. We then forecast inflation to begin to rise again into 2021, but with an expectation of excess supply persisting throughout 2021 in most jurisdictions, we do not expect inflation to return to central bank inflation targets in 2021. In the US we forecast inflation averaging 0.3% (although expect end-year inflation to be in excess of 1%).
Authorities are thus assumed to follow policies aimed at delivering above trend growth to reduce economic spare capacity and monetary authorities specifically should continue to conduct easy monetary policy to achieve rising inflation over subsequent years. It is in this context that we continue to expect a need for monetary policy accommodation, including forward guidance and persistent quantitative easing, for quite some time – even after economic growth recovers.
- VGhlIE9yZ2FuaXNhdGlvbiBmb3IgRWNvbm9taWMgQ28tb3BlcmF0aW9uIGFuZCBEZXZlbG9wbWVudA==
- TmF0aW9uYWwgSW5zdGl0dXRlIG9mIFN0YXRpc3RpY3MgYW5kIEVjb25vbWljIFN0dWRpZXM=
- 4oCcQ29uanVuY3R1cmUgaW4gRnJhbmNlIOKAkyAyNiBNYXJjaCAyMDIw4oCdLCBJbnNlZQ==
- 4oCcRXZhbHVhdGluZyB0aGUgaW5pdGlhbCBpbXBhY3Qgb2YgQ09WSUQtMTkgY29udGFpbm1lbnQgb24gZWNvbm9taWMgYWN0aXZpdHnigJ0sIE9FQ0QsIE1hcmNoIDIwMjAu
- Sm9obnNvbiBSZWRib29rIEluZGV4LCBjb3ZlcmluZyBzYWxlcyBkYXRhIGZyb20gYXJvdW5kIDkwMDAgbGFyZ2UgcmV0YWlsZXJzLCBjb3ZlcmluZyBhcm91bmQgODAlIG9mIHRoZSBvZmZpY2lhbCByZXRhaWwgc2FsZXMgc2VyaWVzLg==
- TGV3aXMsIEQuLCBNZXJ0ZW5zLCBLLiwgYW5kIFN0b2NrLCBKLiwg4oCcTW9uaXRvcmluZyBSZWFsIEFjdGl2aXR5IGluIFJlYWwgVGltZTogVGhlIFdlZWtseSBFY29ub21pYyBJbmRleOKAnSwgTGliZXJ0eSBTdHJlZXQgRWNvbm9taWMsIEZSQk5ZLCBNYXJjaCAyMDIwLg==
Not for Retail distribution
This document is intended exclusively for Professional, Institutional, Qualified or Wholesale Clients / Investors only, as defined by applicable local laws and regulation. Circulation must be restricted accordingly.
This document is for informational purposes only and does not constitute investment research or financial analysis relating to transactions in financial instruments as per MIF Directive (2014/65/EU), nor does it constitute on the part of AXA Investment Managers or its affiliated companies an offer to buy or sell any investments, products or services, and should not be considered as solicitation or investment, legal or tax advice, a recommendation for an investment strategy or a personalized recommendation to buy or sell securities.
It has been established on the basis of data, projections, forecasts, anticipations and hypothesis which are subjective. Its analysis and conclusions are the expression of an opinion, based on available data at a specific date.
All information in this document is established on data made public by official providers of economic and market statistics. AXA Investment Managers disclaims any and all liability relating to a decision based on or for reliance on this document. All exhibits included in this document, unless stated otherwise, are as of the publication date of this document. Furthermore, due to the subjective nature of these opinions and analysis, these data, projections, forecasts, anticipations, hypothesis, etc. are not necessary used or followed by AXA IM’s portfolio management teams or its affiliates, who may act based on their own opinions. Any reproduction of this information, in whole or in part is, unless otherwise authorised by AXA IM, prohibited.
Issued in the UK by AXA Investment Managers UK Limited, which is authorised and regulated by the Financial Conduct Authority in the UK. Registered in England and Wales, No: 01431068. Registered Office: 22 Bishopsgate, London, EC2N 4BQ. In other jurisdictions, this document is issued by AXA Investment Managers SA’s affiliates in those countries.